


When expanding your work within your AWS account or refining your current AWS infrastructure, it's crucial to prioritize laying a solid groundwork for your cloud ecosystem. A key element of this groundwork involves organizing your AWS accounts using a multi-account strategy, commonly called an AWS Landing Zone.
In the AWS Whitepaper Organizing Your AWS Environment Using Multiple Accounts we can learn why you can benefit from a multi-account strategy:
Using multiple AWS accounts to help isolate and manage your business applications and data can help you optimize across most of theAWS Well-Architected Framework pillars including operational excellence, security, reliability, and cost optimization.
Using different AWS accounts to deploy and isolate applications helps with security and financial separation between teams and reduces the impact of issues.
Such a multi-account setup could look like this:
It is vital that we can search, analyze, and correlate cross-account telemetry data stored in CloudWatch.
The AWS Well-Architected Framework Monitoring and Observability guide and the Organizing Your AWS Environment Using Multiple Accounts whitepaper explain this as the following:
Like security, monitoring and observability are required for all teams who operate and administer cloud applications and services. [...] your teams must define, capture, and analyze operations metrics to gain visibility into workload events so that you can take appropriate action.
and:
...an account that acts as a consolidation point for log data that is gathered from all the accounts in the organization and primarily used by your security, operations, audit, and compliance teams. This account contains a centralized storage location for copies of every account’s audit, configuration compliance, and operational logs
Achieving this in an initial setup can be challenging!
We recently covered how to achieve this goal with different solutions in the comprehensive guide CloudWatch Strategies for Cross-Account and Cross-Region Log Aggregation written by Eduardo Rabelo.
In this blog post, we will show you what the Observability Access Manager is and how you can achieve a dedicated monitoring account with it.
What is the Observability Access Manager (OAM)?
Observability Access Manager (OAM) allows you to monitor all the components of your applications from a centralized view.
It creates cross-account observability to search, analyze, and correlate cross-account telemetry data stored in CloudWatch, such as metrics, logs, and traces.
We want to get observability over data such as:
CloudWatch Logs
CloudWatch Metrics
X-Ray Traces
From multiple accounts into one dedicated Monitoring account.
Sinks Point to the Monitoring Account and Links Send Application Data
You work with three components when configuring CloudWatch OAM:
Sink - This is the destination point. This is typically a monitoring account.
Link - This is the connection between a source account (where your application runs) and your Sink (monitoring account).
Sink Policy - The policy grants permission to source accounts to connect links to the monitoring account.

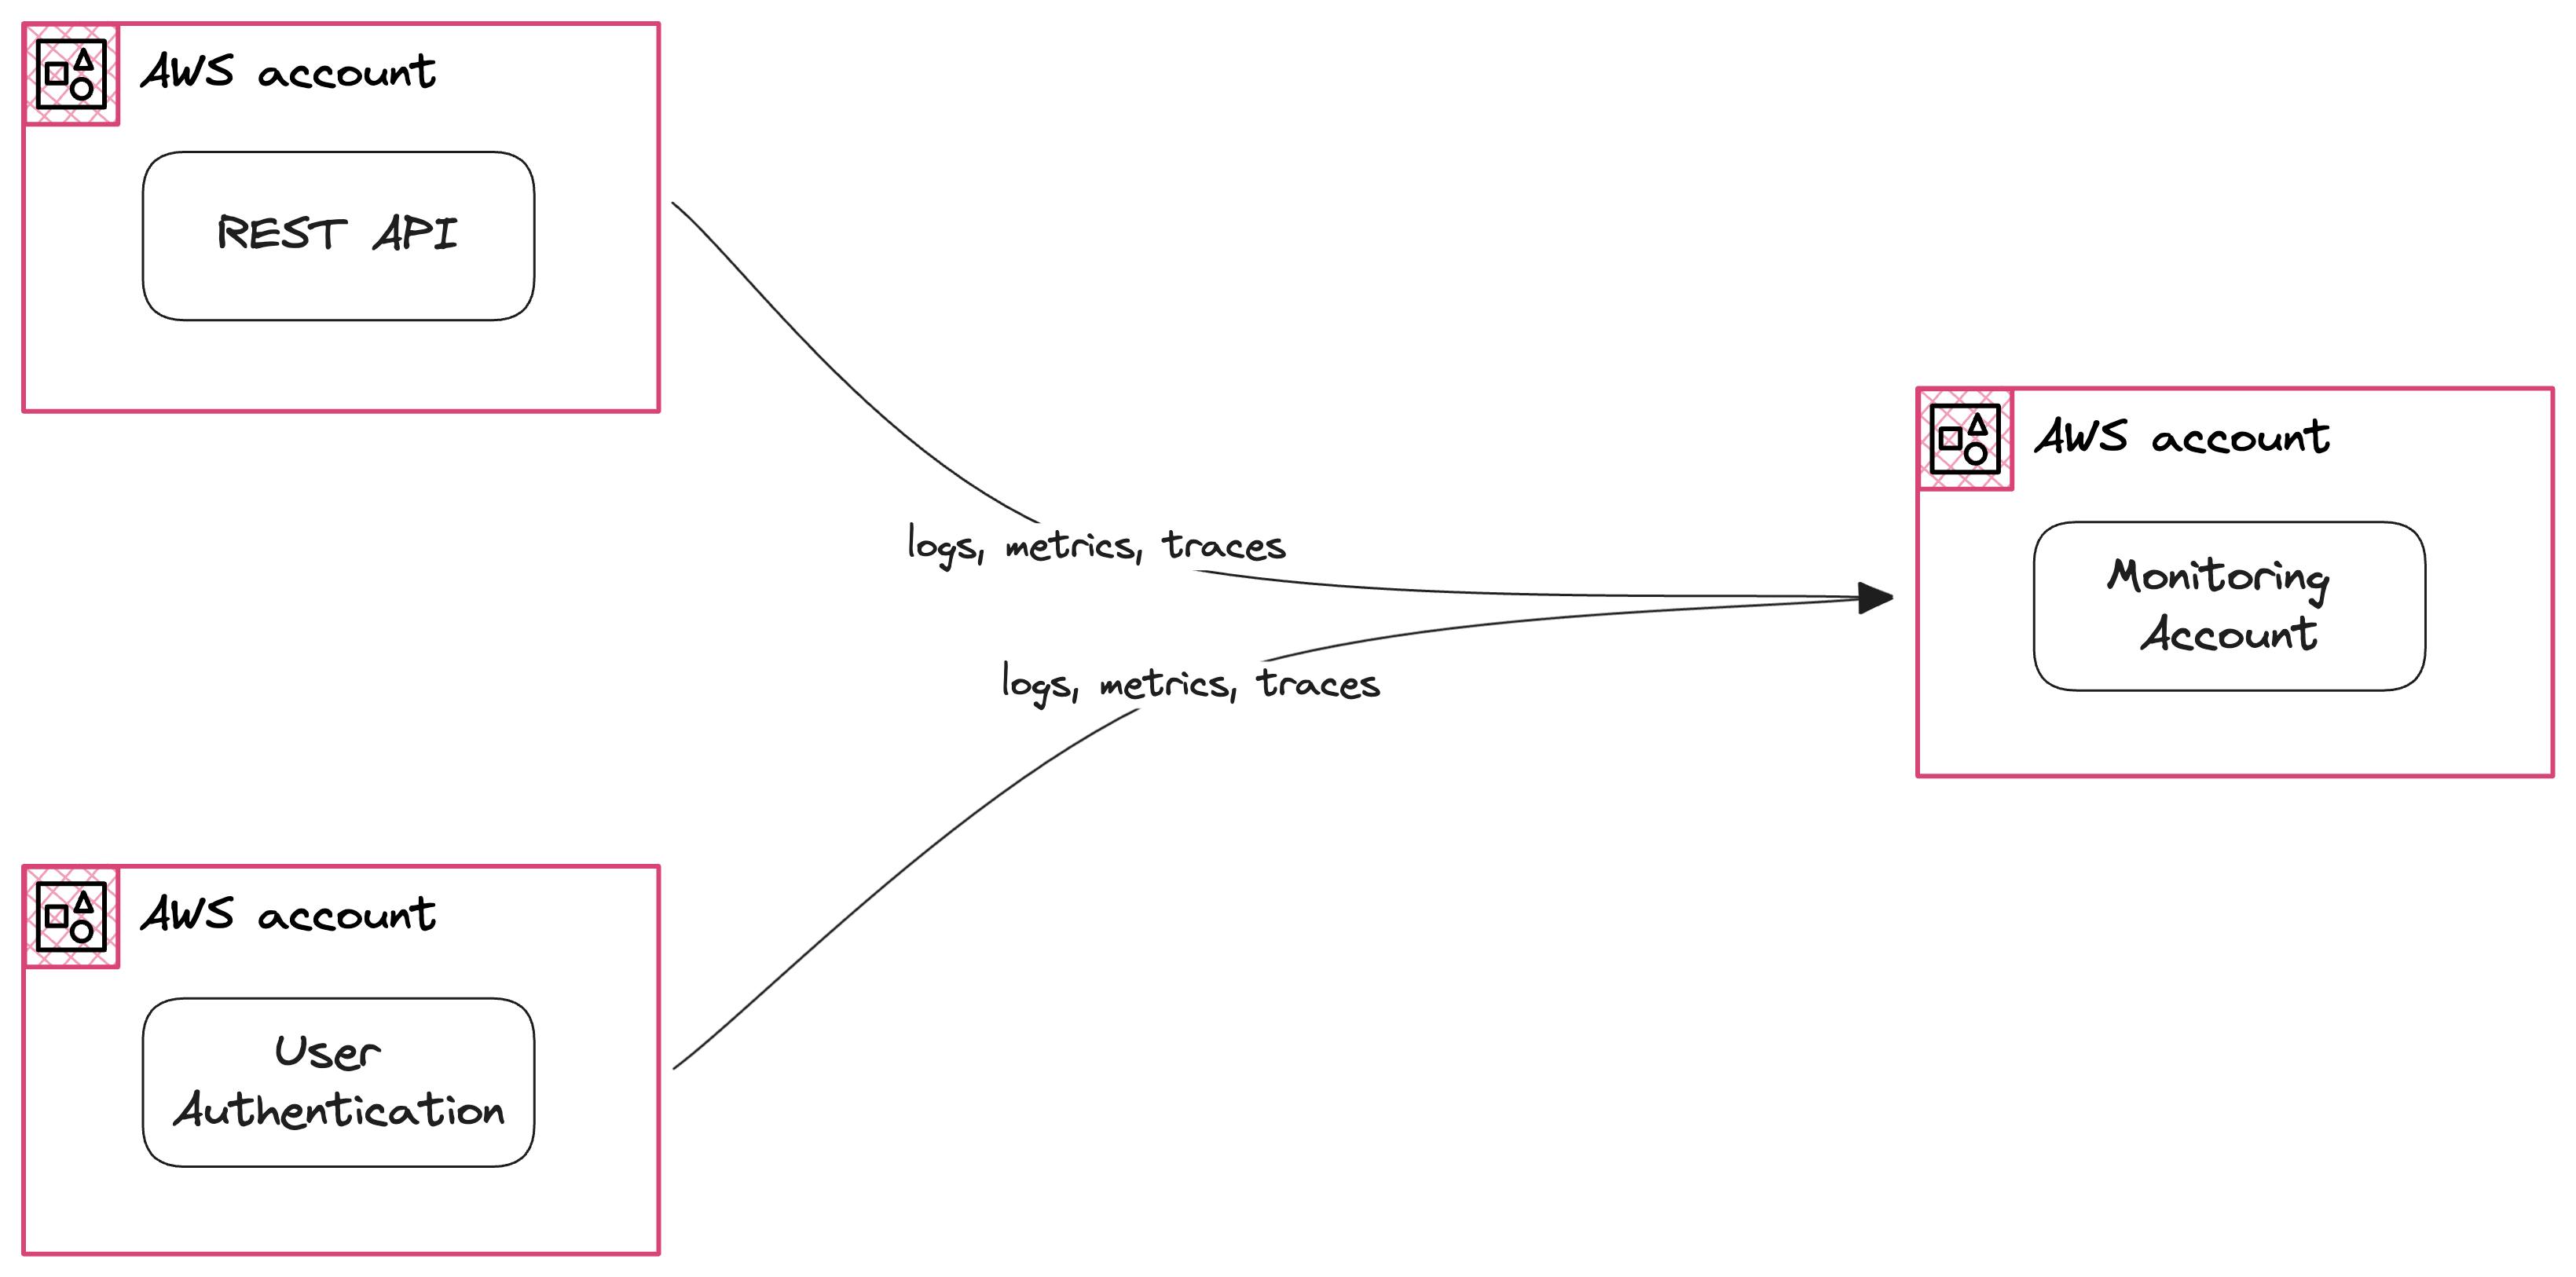
We see three AWS accounts in the previous picture:
Source Account A
Source Account B
Monitoring Account
Imagine both your Source accounts are running two different applications, such as a REST API in A and User Authentication in B. You want to send data to your central account in the central region us-east-1.
This is easily possible with OAM now.
You can create a single Sink in us-east-1 in the Monitoring account. You create a Link in the AWS accounts running workloads where logs, metrics trace, and insights are generated.
A Sink Policy is similar to Resource-based Policies. When you create a Sink Policy, you can grant permissions to all accounts in an AWS Organizations or individual accounts via AWS Account Id. You can also use the Sink Policy to limit the shared data types. The four types that you can allow or deny are:
Metrics: Links in Source accounts can send CloudWatch Metrics to the Sink in the Monitoring account. Enable this by adding the
AWS::CloudWatch::Metrictype to your Sink Policy.Log Groups: Links in Source accounts can send CloudWatch Logs to the Sink in the Monitoring account. Enable this by adding the
AWS::Logs::LogGrouptype to your Sink Policy.Traces: Links in Source accounts can send AWS X-Ray Traces to the Sink in the Monitoring account. Enable this by adding the
AWS::XRay::Tracetype to your Sink Policy.Application Insights - Applications: - Links in Source accounts can send CloudWatch Application Insights to the Sink in the Monitoring account. Enable this by adding the
AWS::ApplicationInsights::Applicationtype to your Sink Policy.
A complete example of a Sink Policy sharing all types of data:
{
    Version = "2012-10-17",
    Statement = [
      {
        Action   = ["oam:CreateLink", "oam:UpdateLink"],
        Effect   = "Allow",
        Resource = "*",
        Principal = {
          AWS = ["SOURCE_A_ACCOUNT_ID", "SOURCE_B_ACCOUNT_ID"],
        },
        Condition = {
          "ForAllValues:StringEquals" = [
              "AWS::ApplicationInsights::Application",
              "AWS::CloudWatch::Metric",
              "AWS::Logs::LogGroup",
              "AWS::XRay::Trace",
          ],
        },
      },
    ],
  }
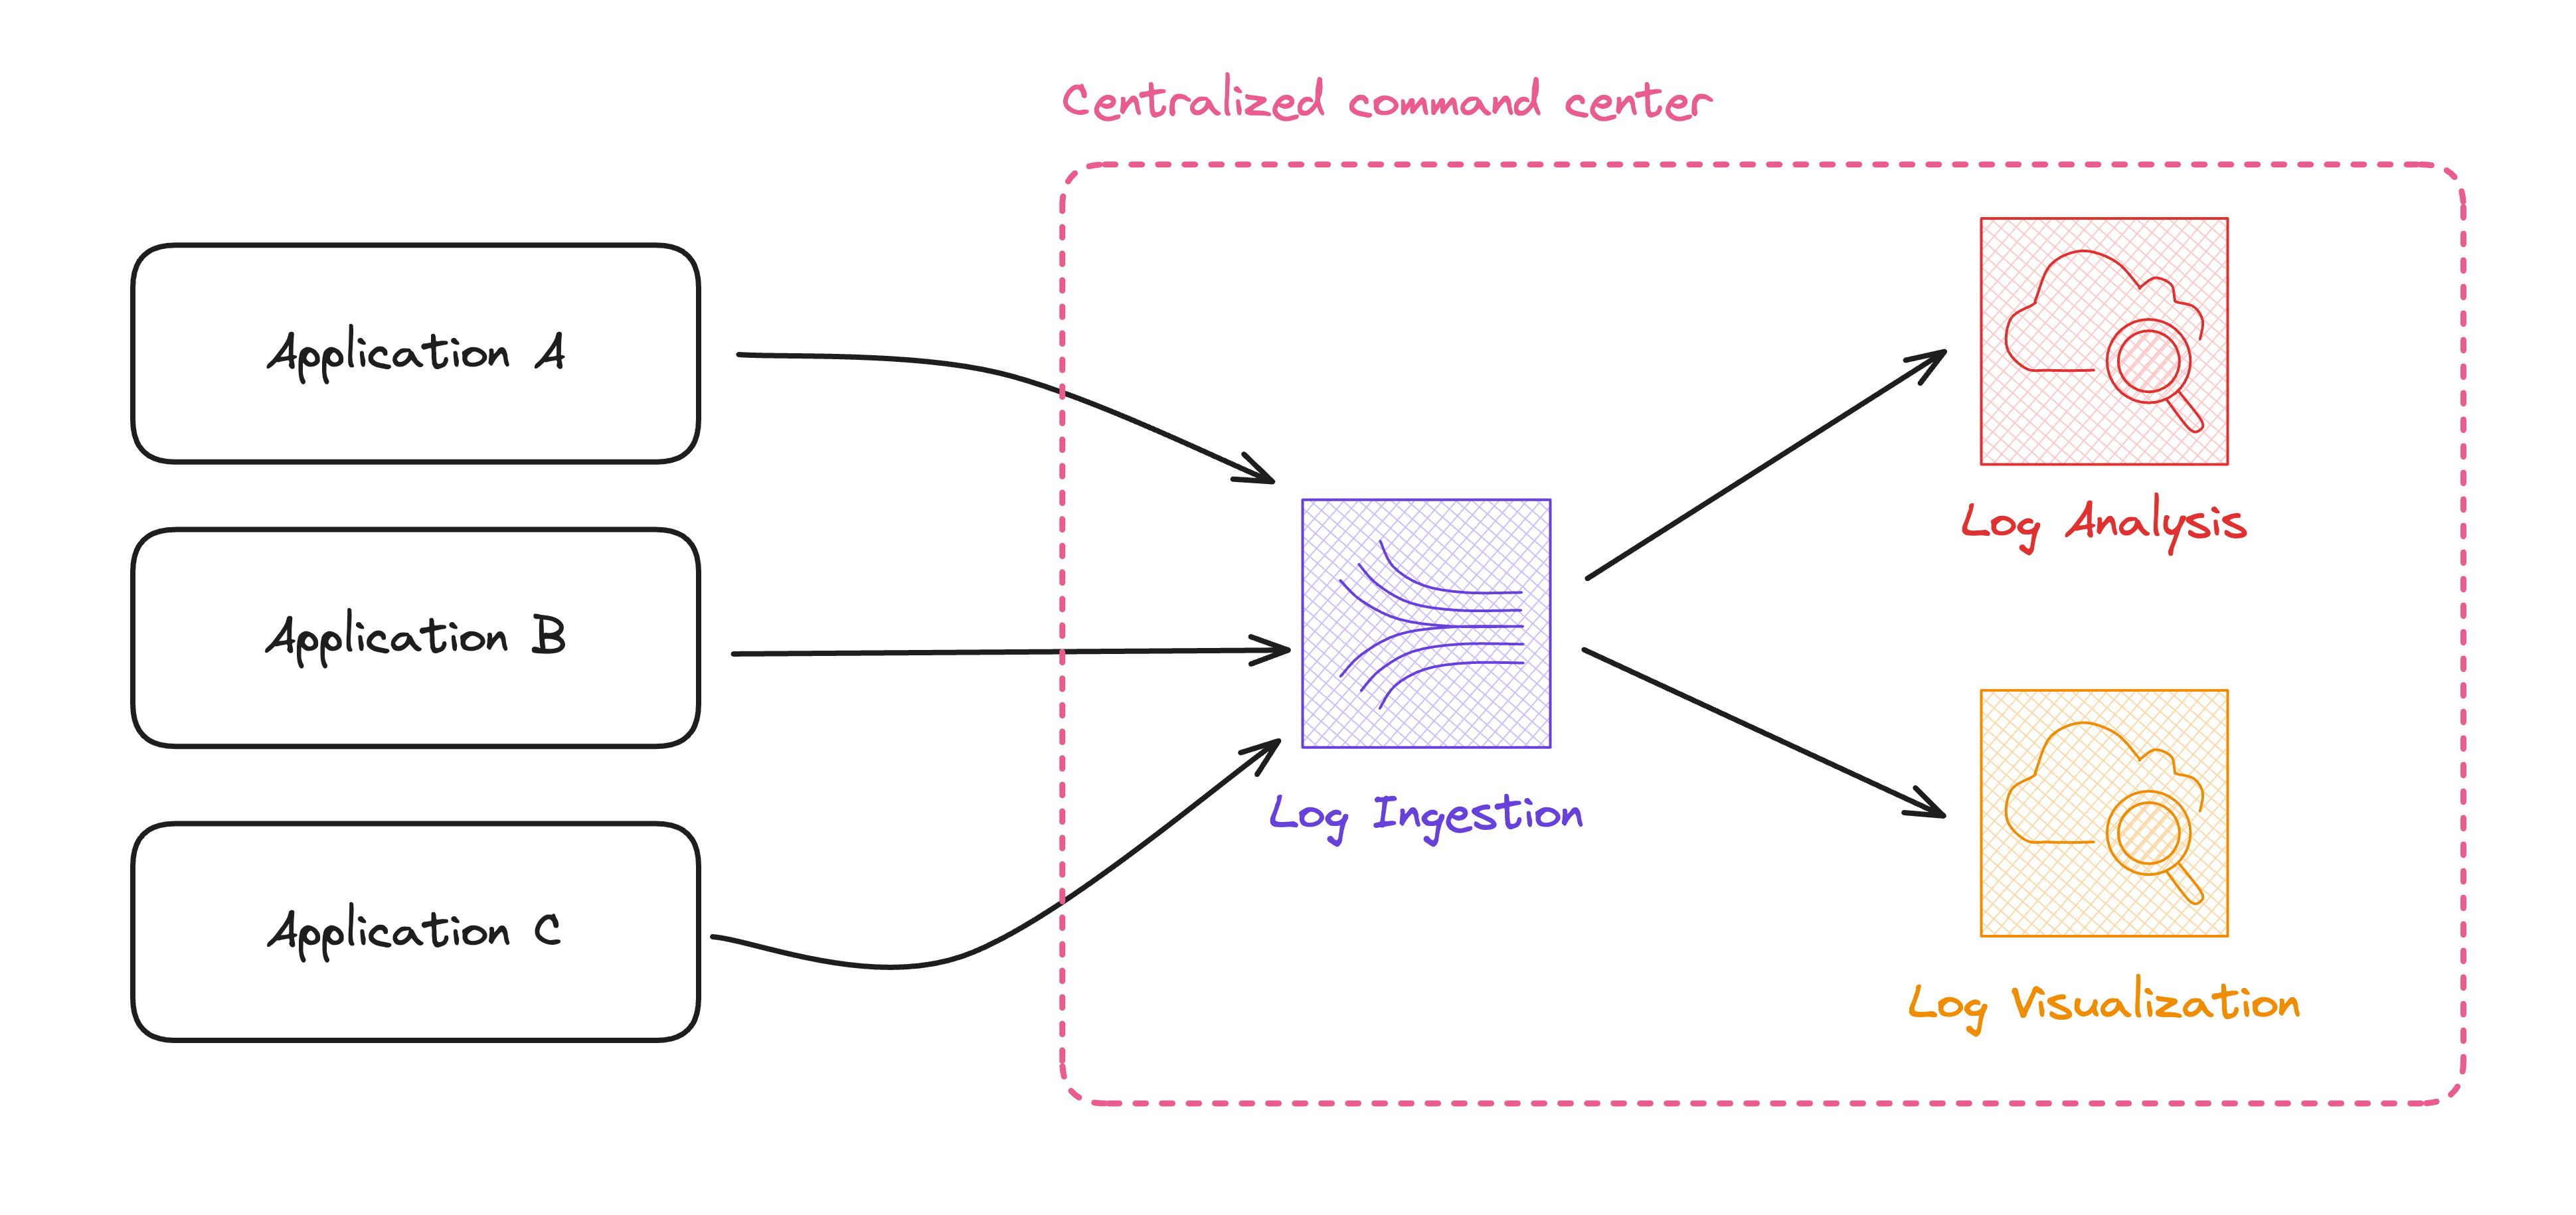
Without OAM we need to ingest logs manually into a central account, using a mix of Kinesis Data Streams, CloudWatch Logs Filter, and Destinations. A complex and error-prone process:
Are you tired of digging through Log Groups? Sign up for our waitlist for the CloudWatch Book!
The Limitation That Was Lifted
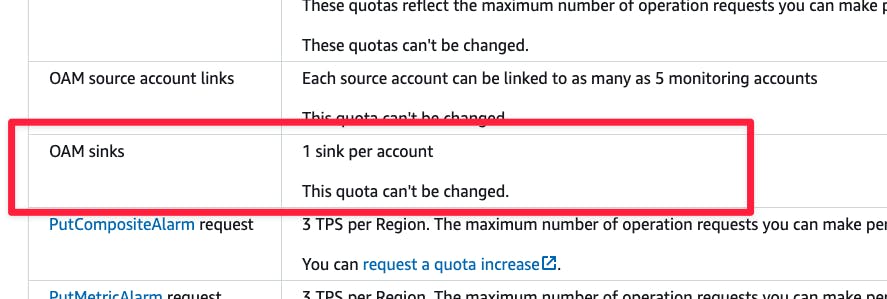
AWS just recently lifted one huge limitation of their Observability Access Manager to help with that.
In Eduardo's guide, we learn about a native CloudWatch solution called Observability Access Manager. The CloudWatch Service Quota declares we can have a single Sink (we see in a second what that is) per AWS account.
That would mean if we have a setup like this:
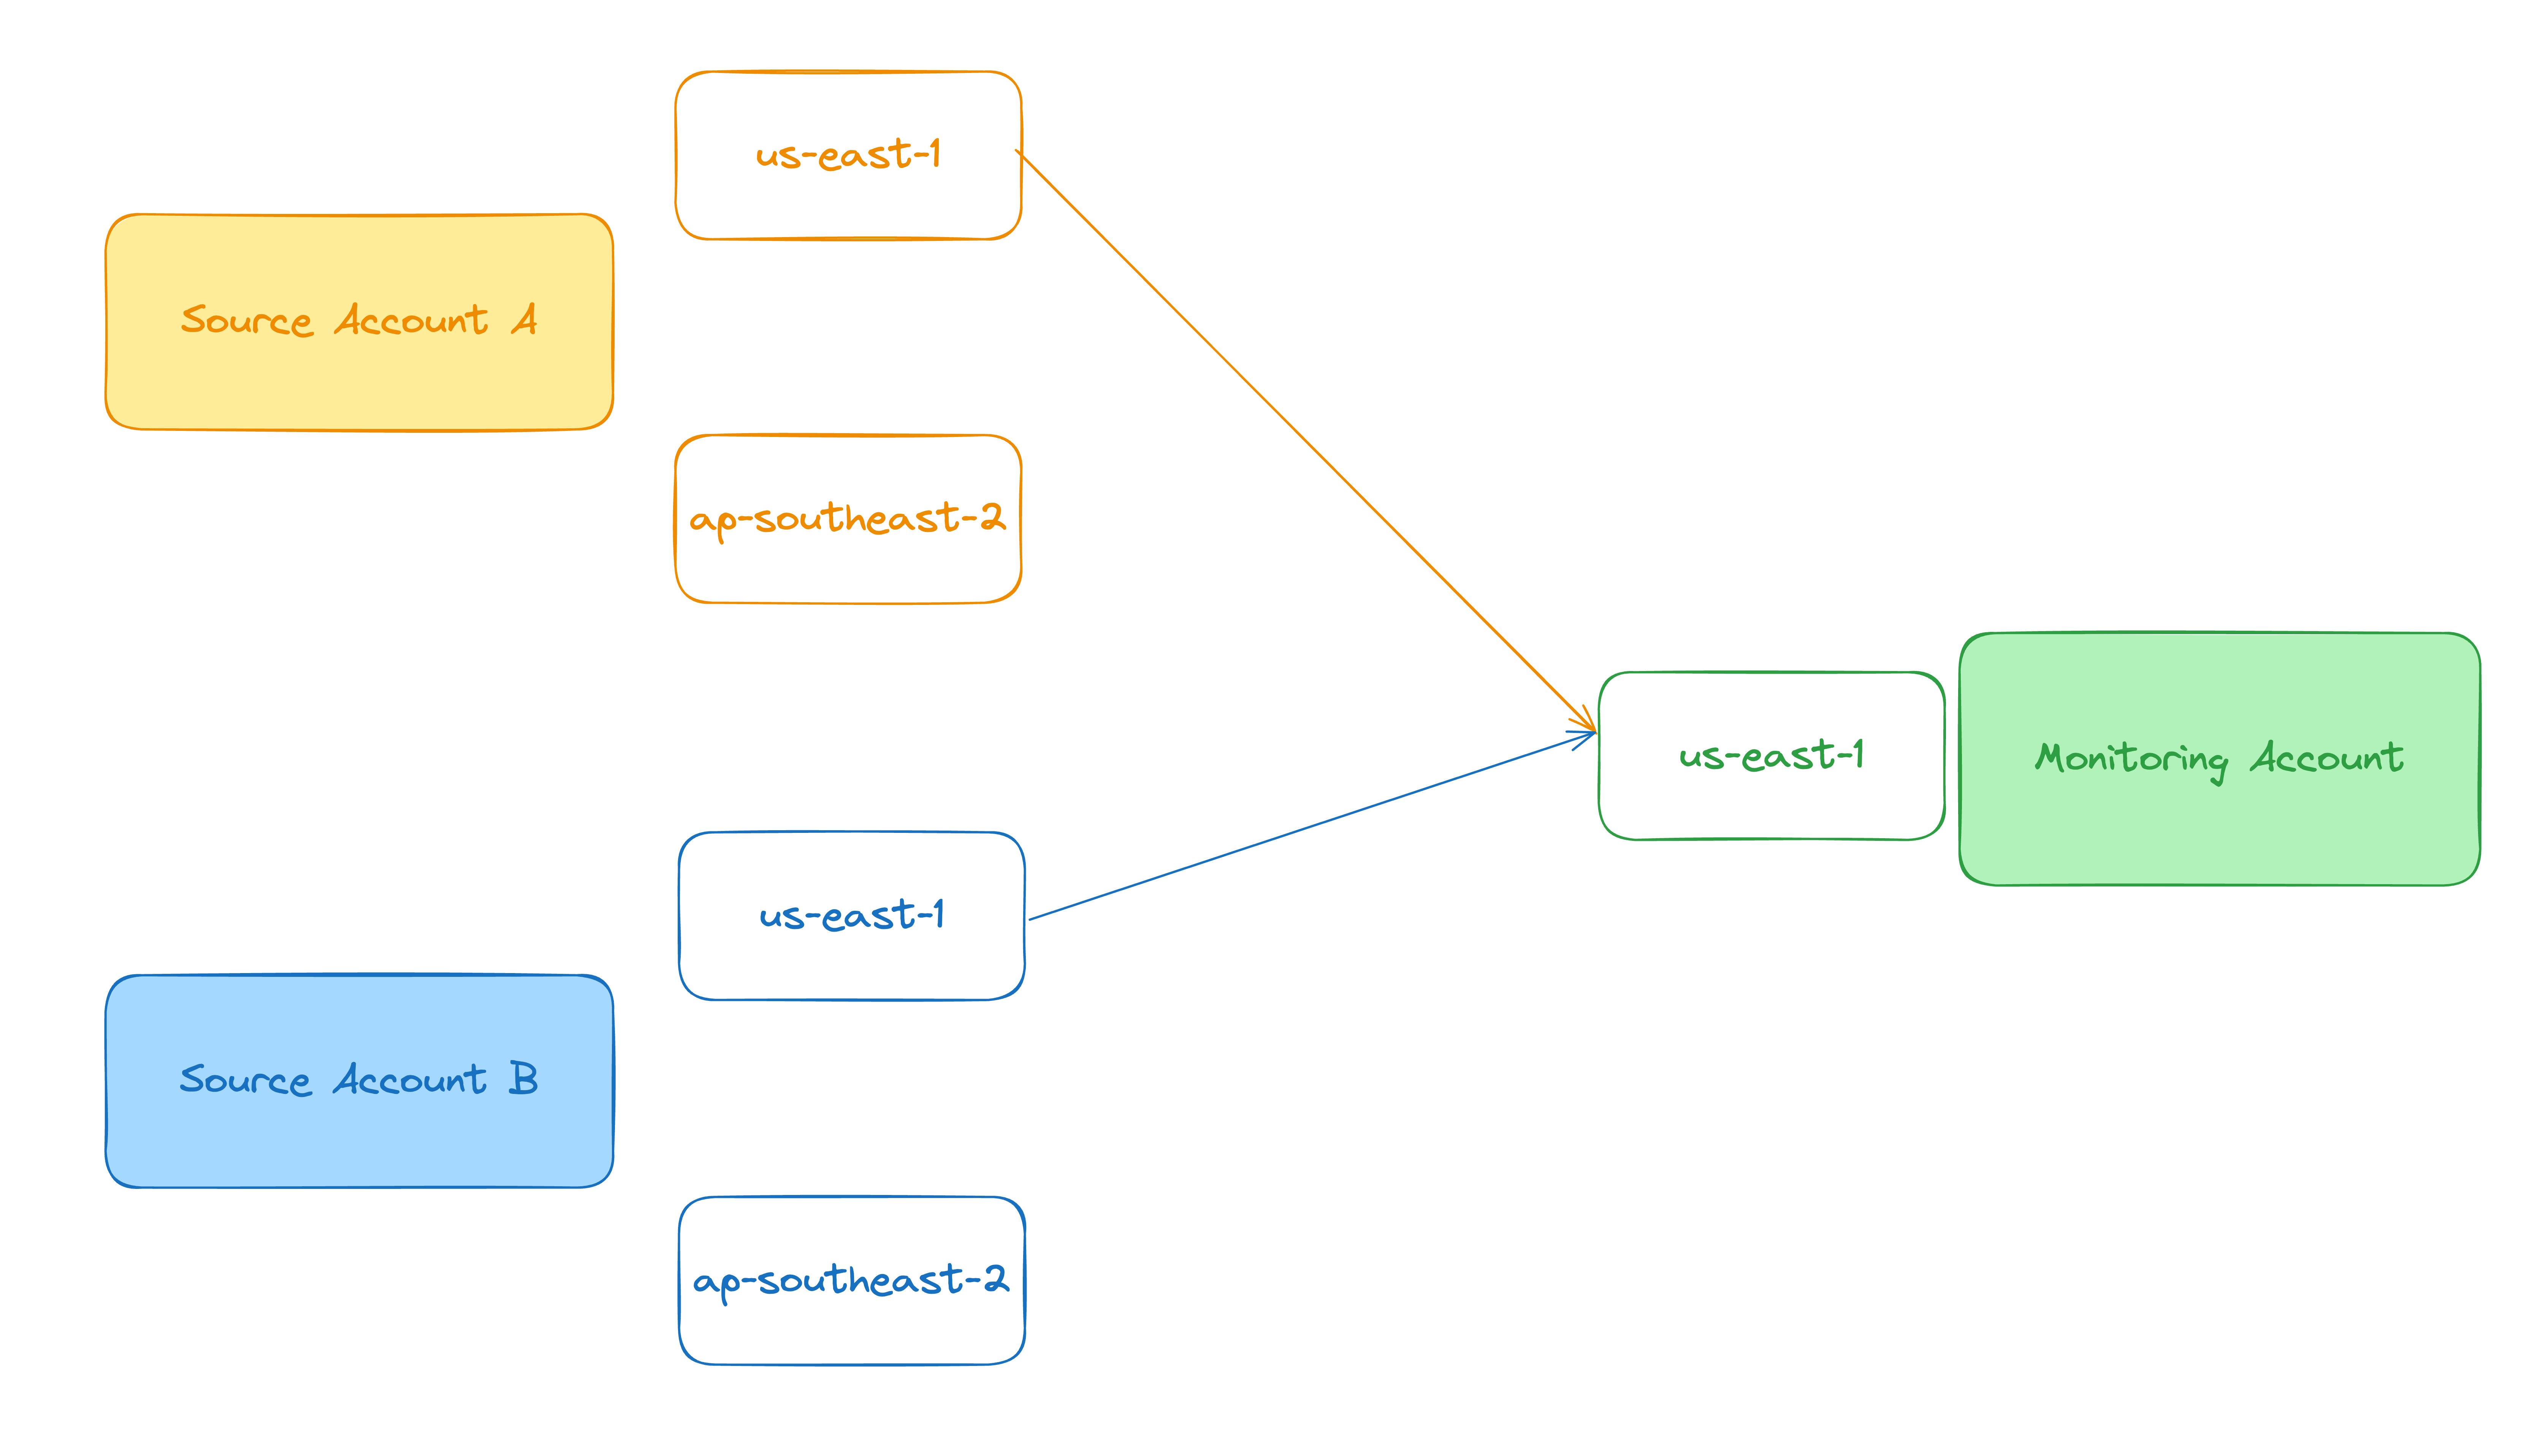
We couldn't see any logs from the region ap-southeast-2.
In practice, this is no longer a limit! Steve Weldon left a comment in one of our discussions on GitHub that we could operate multiple Sinks in the same AWS account.
The official documentation is still outdated on that. We hope this will be fixed soon.
Deploy it!
We don't come without code 😎
Eduardo Rabelo built the whole flow in CDK (SST/ION) and Terraform. Check out the GitHub repository for that:
This repository assumes that you use AWS Organizations and know how to handle the trust relationship of the role OrganizationAccountAccessRole.
If you need help with that, please comment or DM us in our Discord server 😉
After you have all three accounts, you can supply the account IDs after you hit terraform apply.
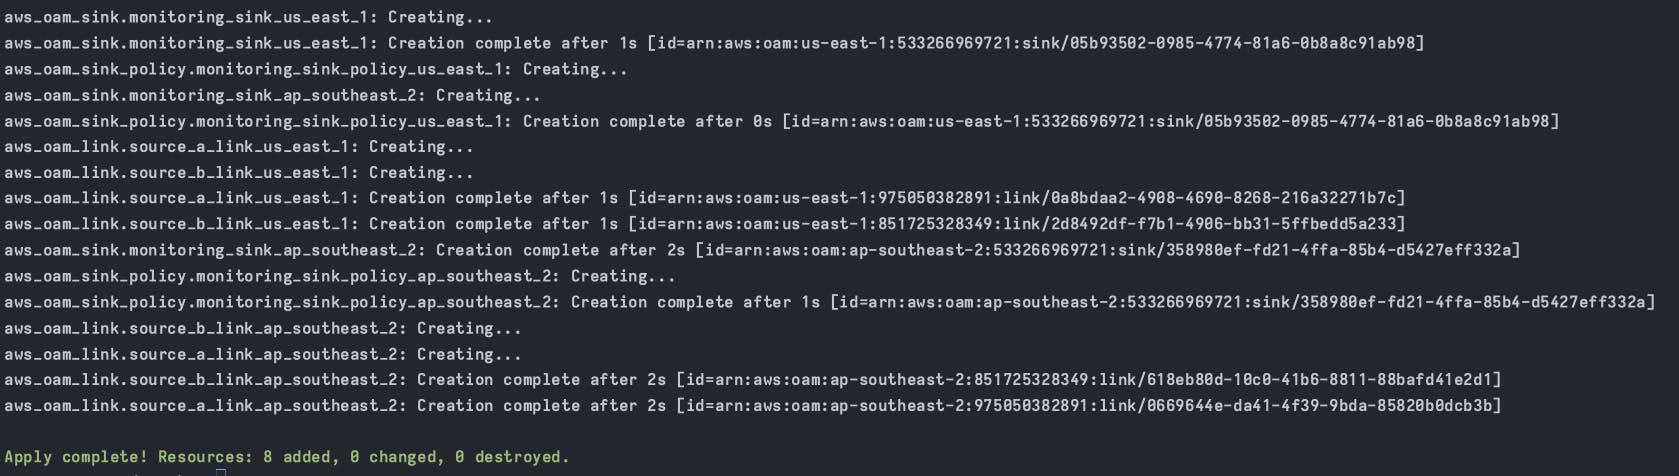
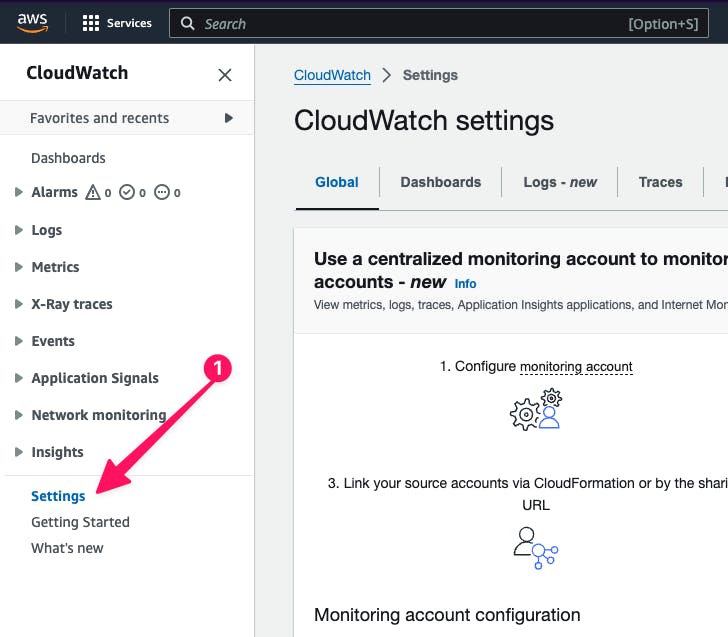
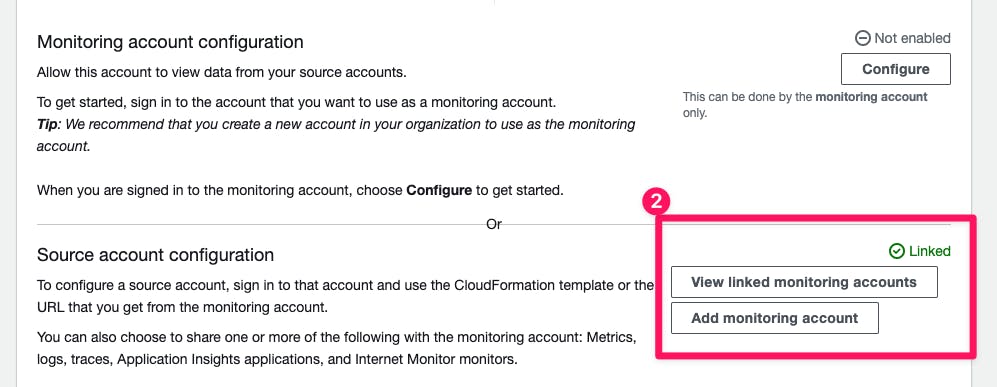
When the deployment is completed, go to the CloudWatch dashboard -> Settings page and see the different status.
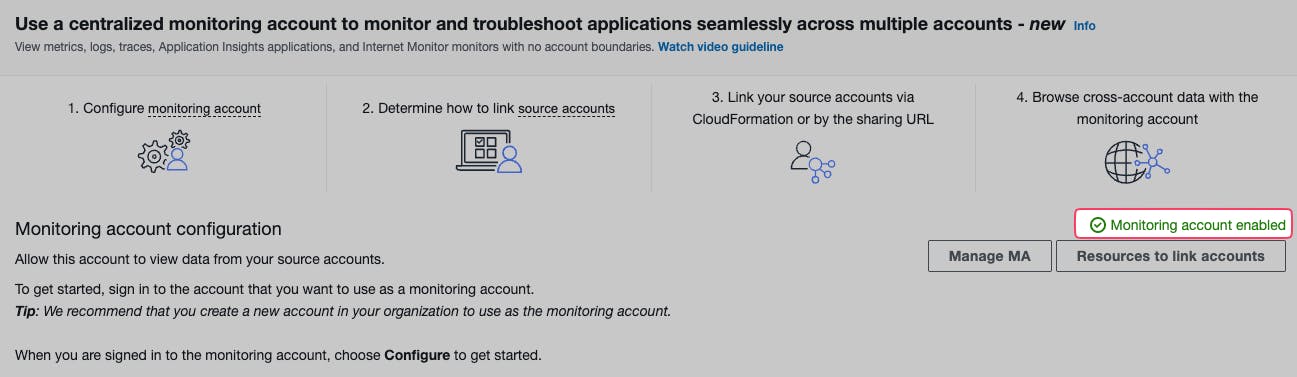
You will see a Monitoring account enabled text for the Monitoring account:
And "Linked" for source accounts:
Summary
Adopting OAM allows you to overcome the challenges of managing data spread across different accounts, as described in the CloudWatch aggregation strategies guide.
OAM setup involves configuring Sinks, Links, and Sink Policies to establish connections between source and centralized monitoring accounts. This straightforward approach facilitates efficient monitoring and analysis of application components, including CloudWatch Logs, Metrics, X-Ray Traces, and Application Insights.
Without OAM, organizations resort to manual ingestion methods, which are complex and error-prone.
We also provided a sample OAM implementation using CDK (SST/ION) and Terraform, ensuring seamless deployment and configuration. Following the steps provided and leveraging the GitHub repository can enhance your observability capabilities and monitoring processes.
We are excited by the Observability Access Manager capabilities. Now, we can achieve enhanced visibility and control over our AWS environments, enabling better decision-making and proactive management of cloud resources.