


Table of contents
- A Summarizing Infographic
- Our initial journey
- Designated Monitoring Account
- Does CloudWatch offer a native solution for cross-account and cross-region aggregation?
- Third-party and open-source solutions for cross-account and cross-region log aggregation
- Custom CloudWatch solution for cross-account and cross-region log aggregation
- If there's a will, there's a way!
- Conclusion
As cloud infrastructures evolve, they often transform from a single-account, straightforward setup to a sprawling multi-account ecosystem.
This article jumps into the journey of scaling cloud operations, addressing log management challenges as projects and applications expand across various AWS accounts and regions.
We'll explore strategies for maintaining oversight and control through effective log aggregation techniques.
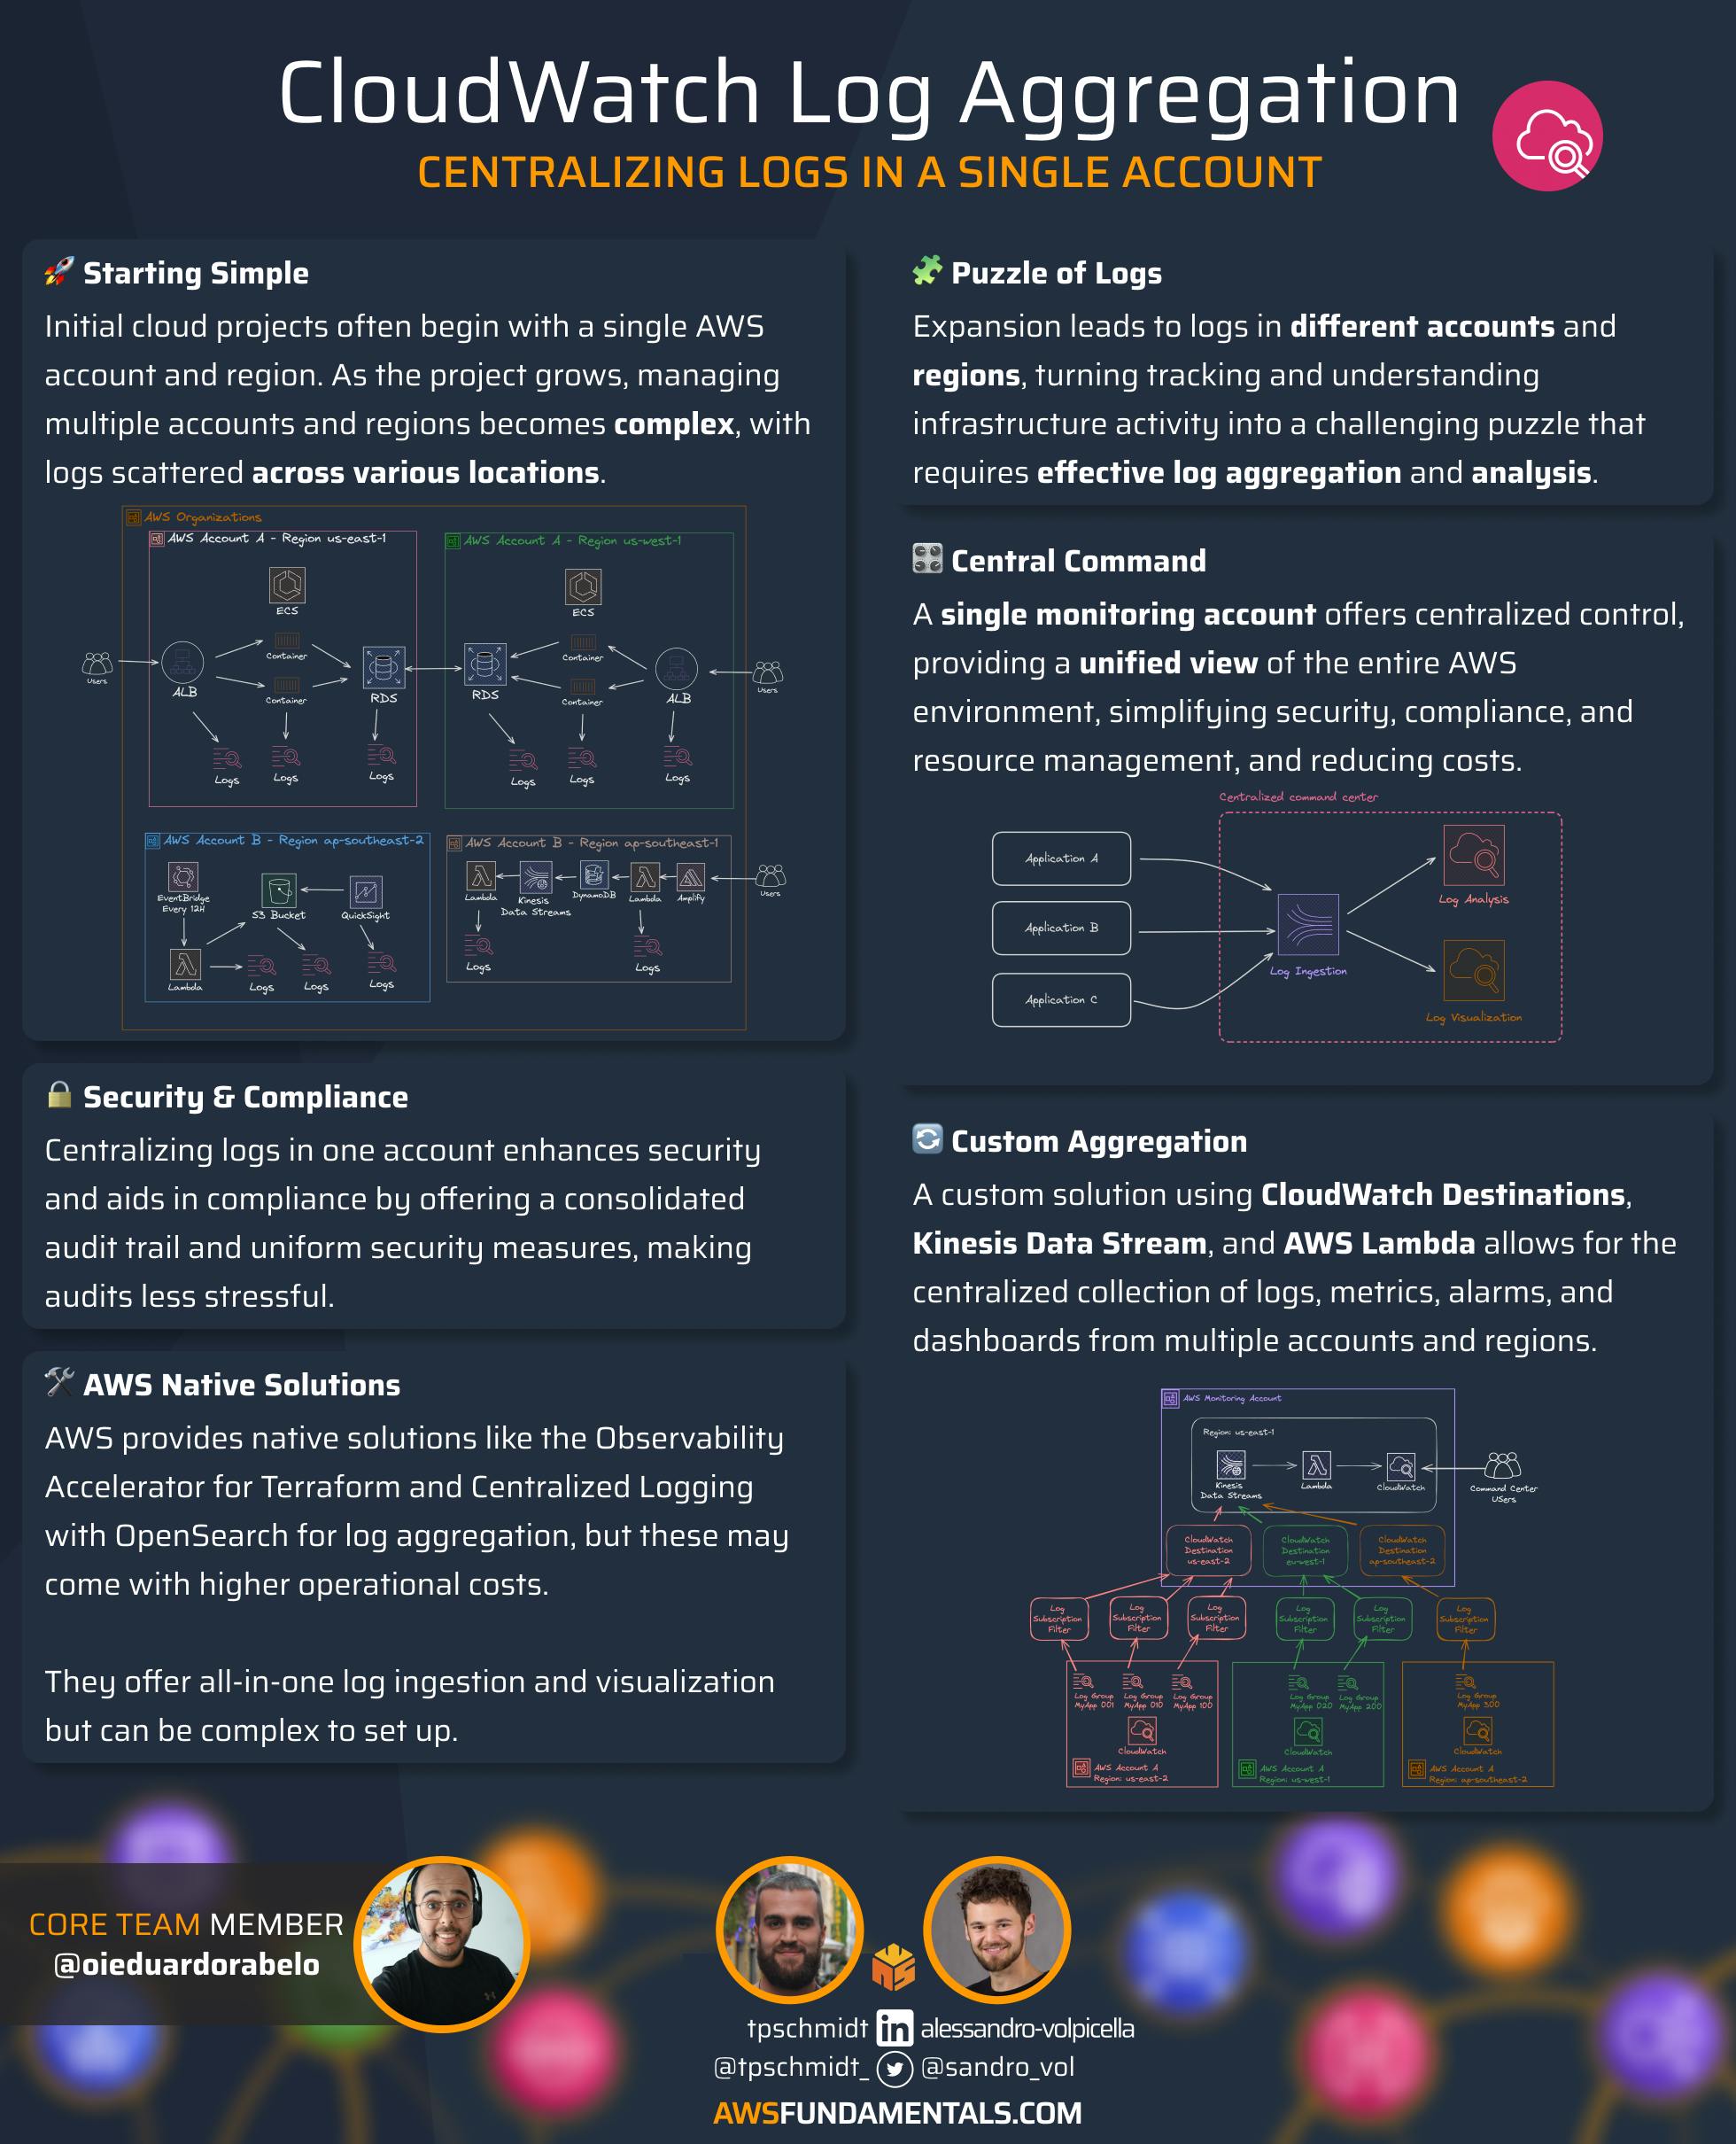
A Summarizing Infographic
If you'd like to see a brief summary of the article beforehand, take a look at the following infographic. However, be sure to read the entire article as well!
Our initial journey
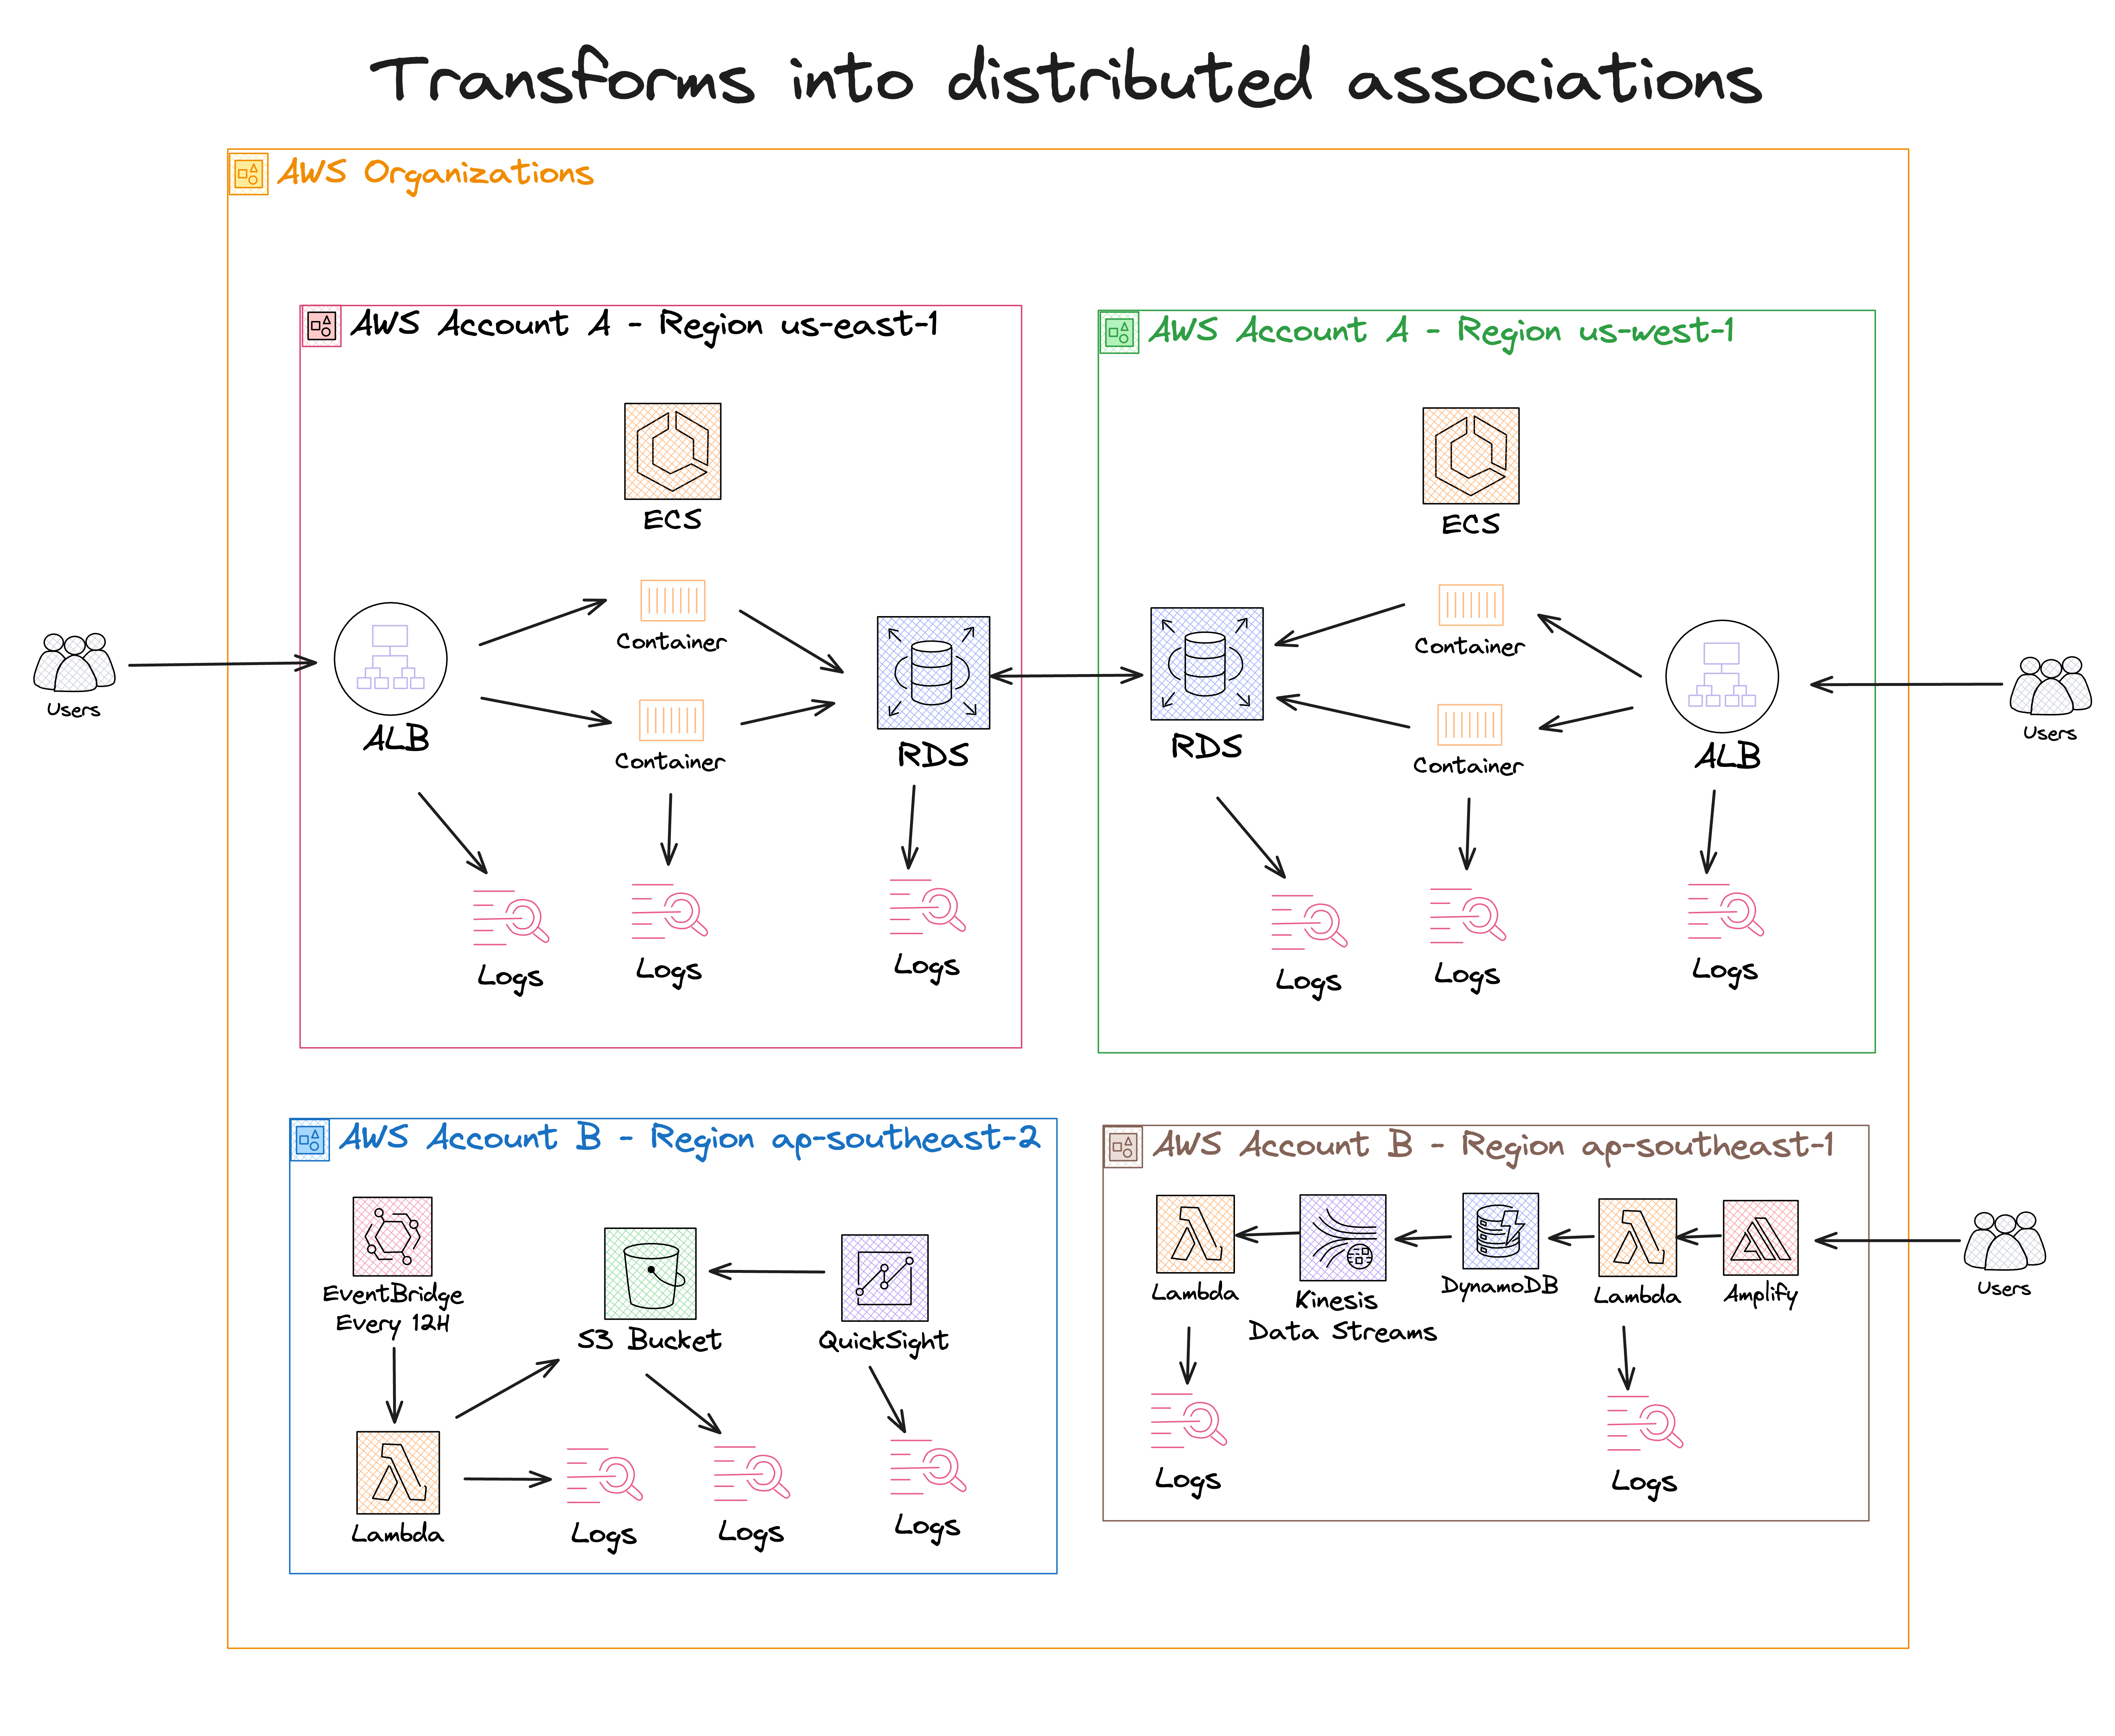
Many of us in the cloud world embark on one journey, starting with that one AWS account and a neat little project. It's all smooth sailing until your project takes off, and suddenly, you're juggling multiple accounts and projects spread out over different regions.
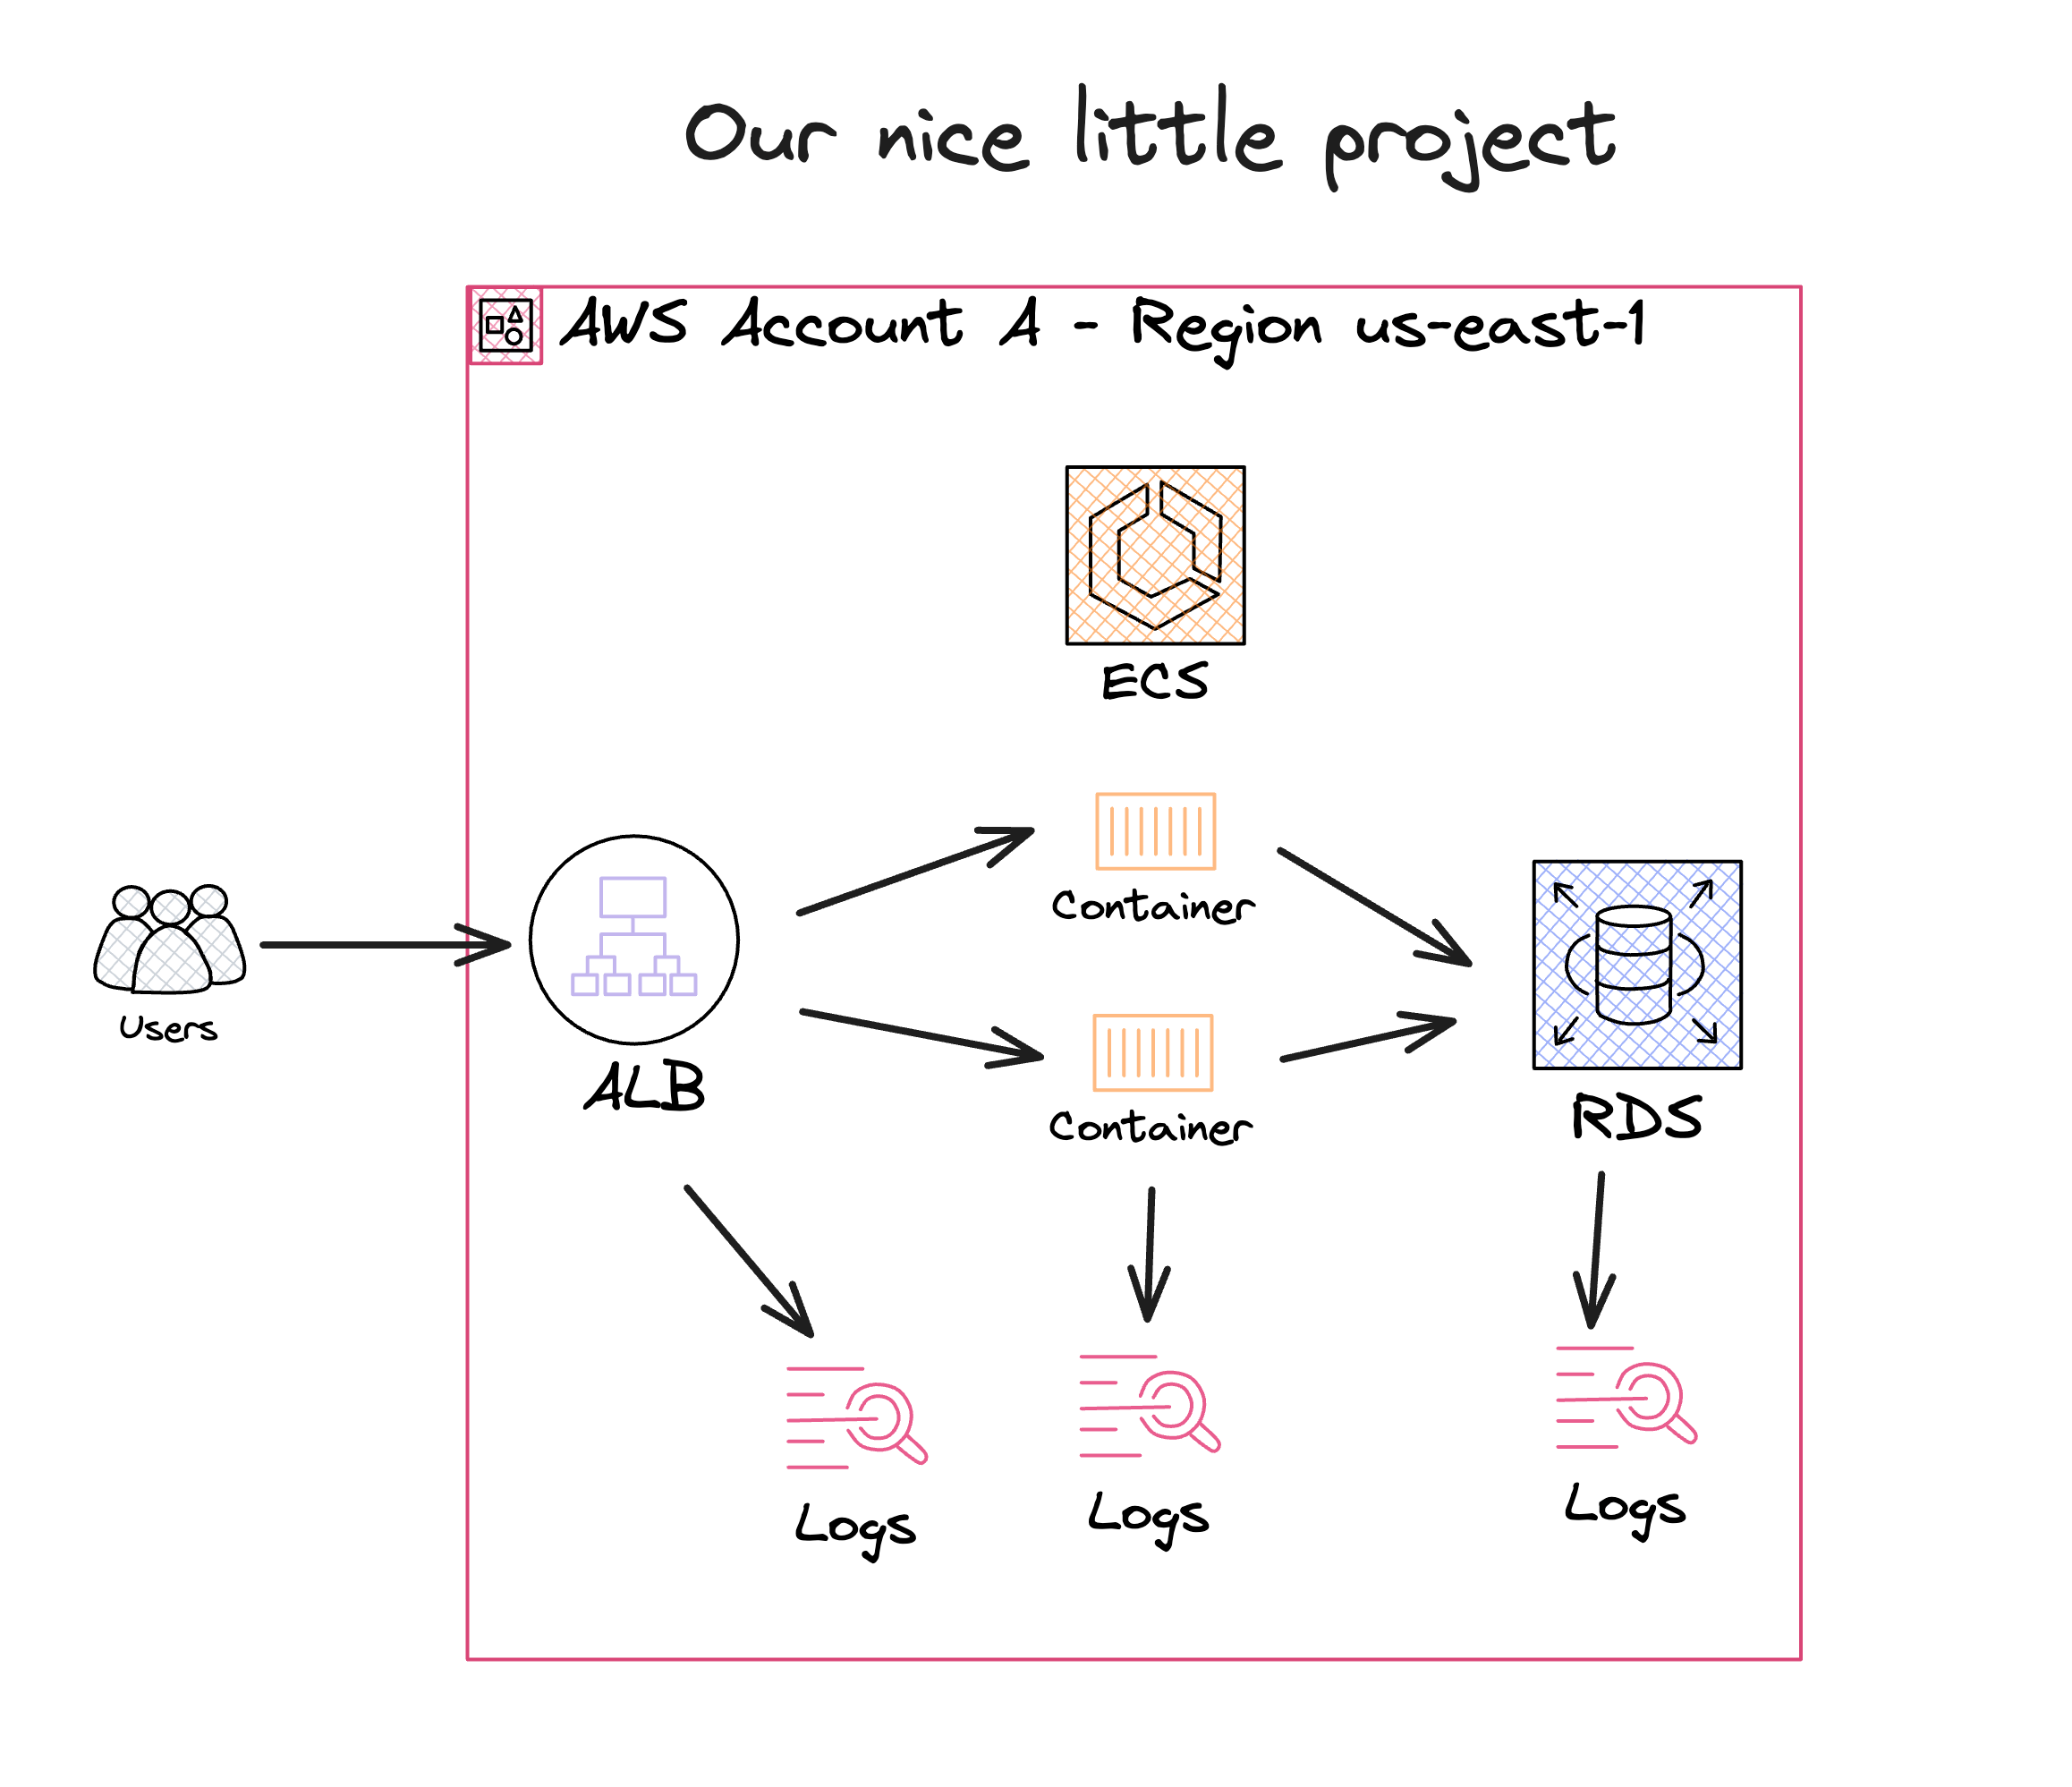
Remember the early days? One account, one region. You could keep an eye on everything with a glance. But as your projects grow and multiply, so do the complexities. You have logs in different regions and accounts like puzzle pieces scattered everywhere. Keeping track of what's happening turns into a real brain teaser.
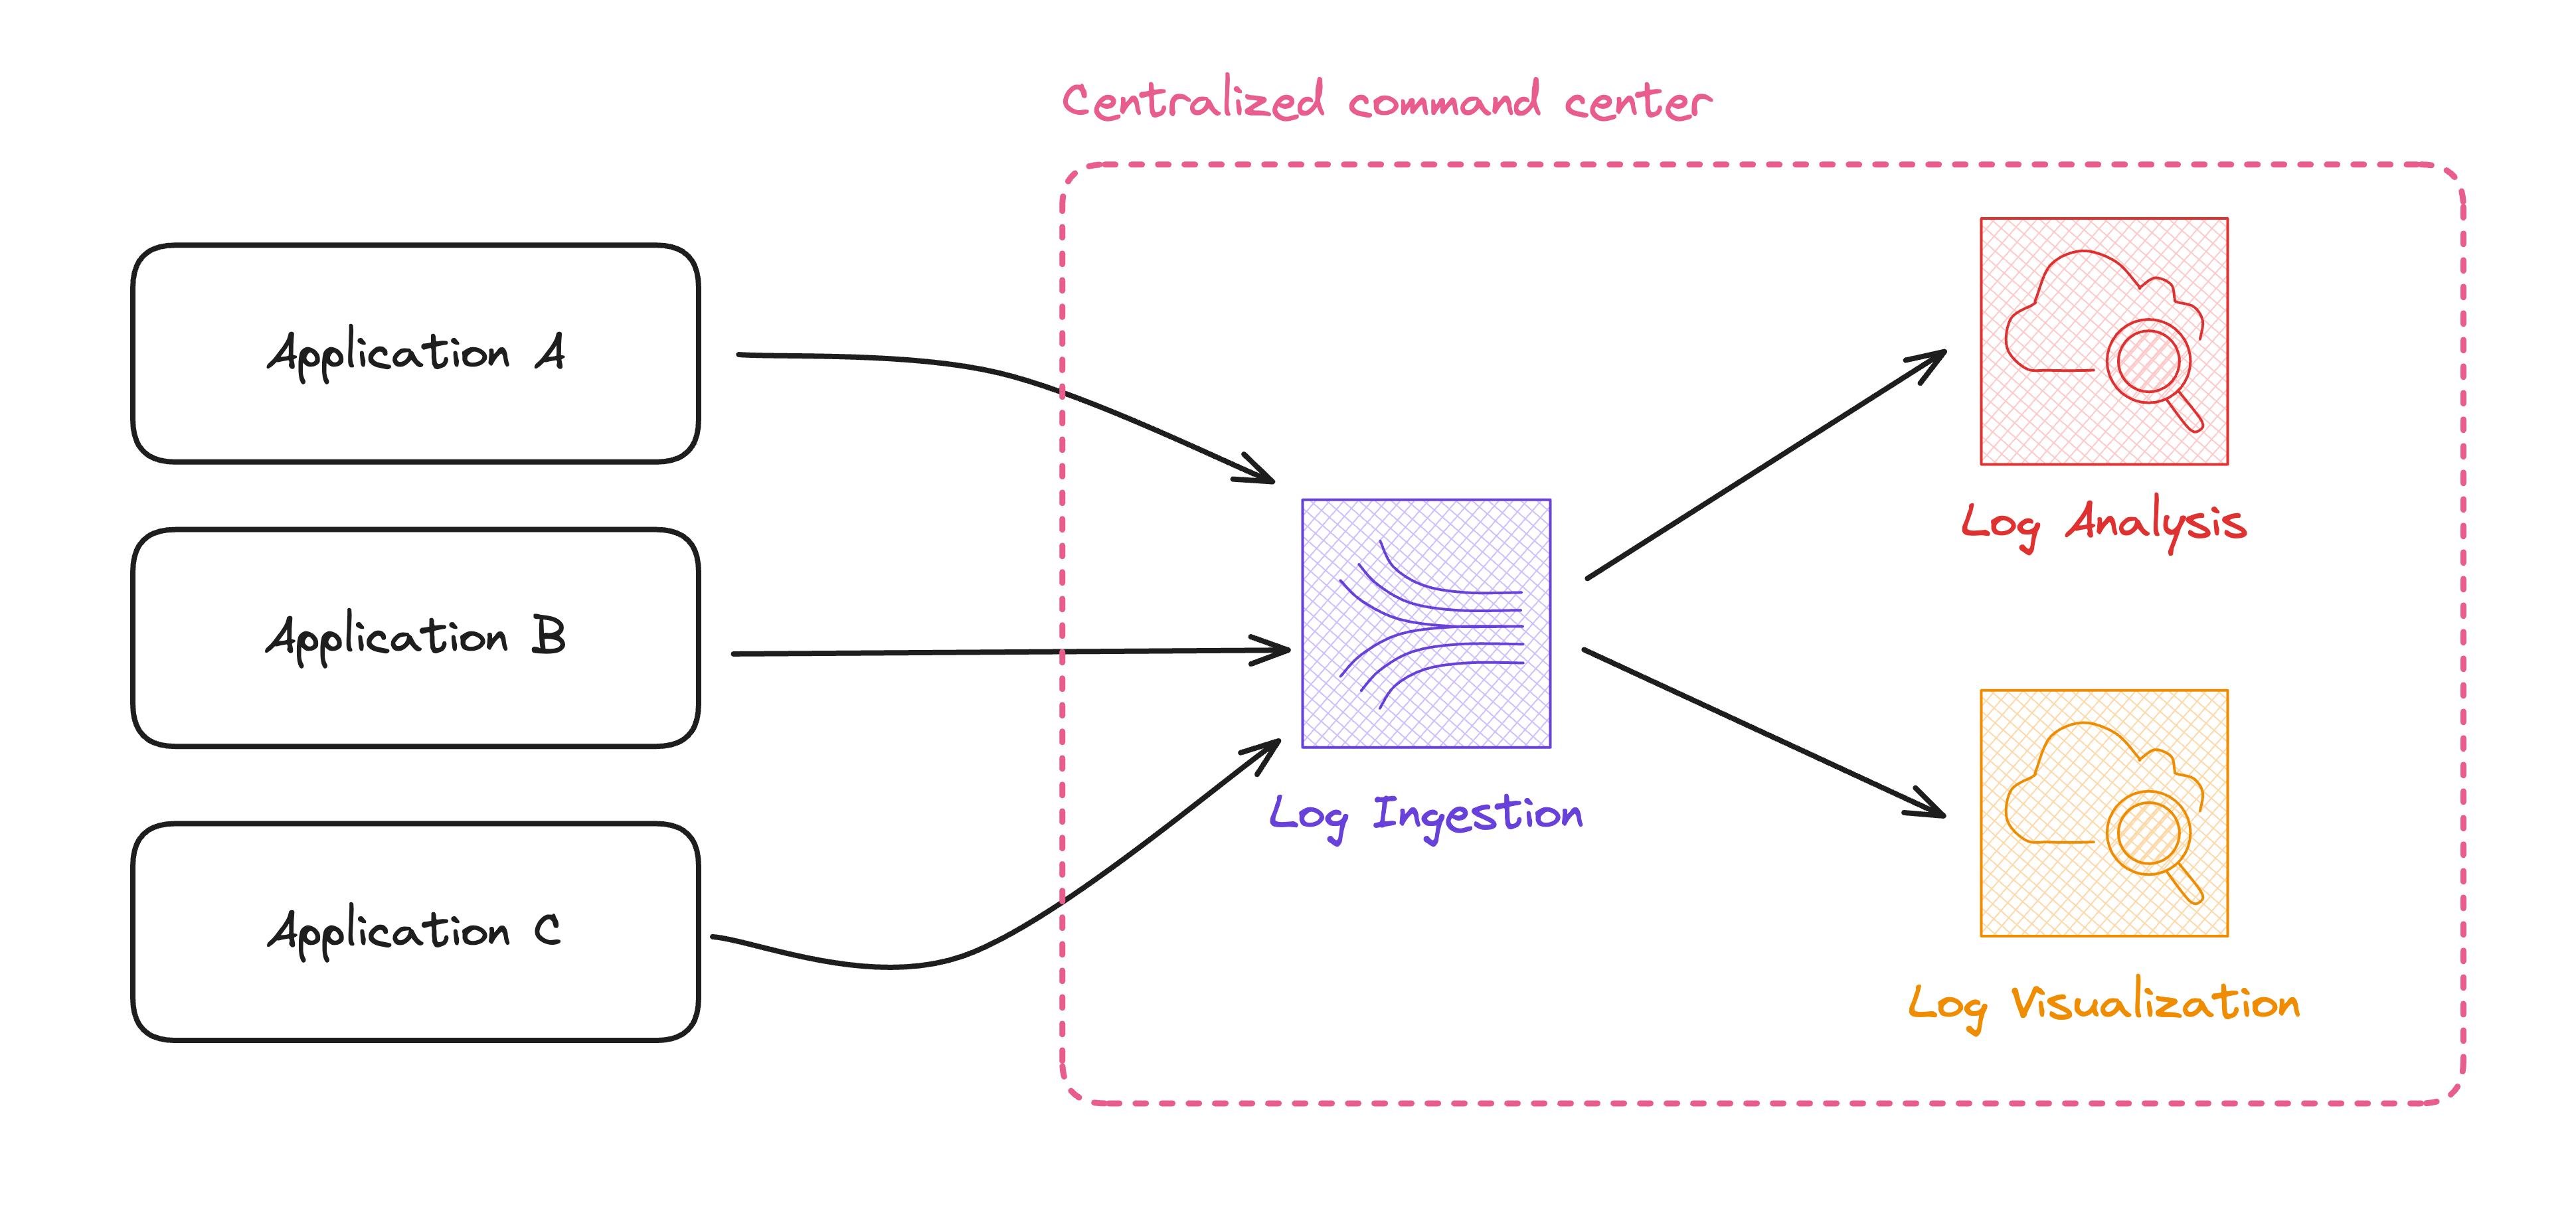
That's where things get tricky. Think of it as gathering all those scattered puzzle pieces and putting them together to see the whole picture. This is the log ingestion phase. With everything in one place, you can spot issues faster, understand what's happening across your entire infrastructure, and make smarter decisions. This is the log analysis phase.
It's like having a command center that gives you the lowdown on everything, from server hiccups in one region to traffic spikes in another. It's not just about making life easier, but that's a big part! This is the log visualization phase.
Aggregating logs across accounts and regions is also essential for security and compliance. It helps you stay on top of any sneaky security threats and prove to those auditors that you're keeping everything above board.
Now, I won't sugarcoat it – setting this up can be a bit of a head-scratcher. By the end of this article, you'll be ready to tackle log aggregation like a pro, turning what seems like a messy challenge into a streamlined, efficient part of your AWS strategy.
Whether you're a seasoned AWS veteran or just spreading your wings, there's something here for everyone looking to make sense of their growing cloud landscape.
Designated Monitoring Account
Let's now zoom in on a common strategy many use as their infrastructure grows: designating one account specifically for monitoring purposes. This is like picking one team member to be the lookout, keeping an eye on everything while the rest focus on their specific tasks.
Why a Single Monitoring Account?
Centralized Control and Visibility: Imagine trying to watch a bunch of TV screens showing different channels at once. Pretty chaotic, right? Now, replace the TVs with your AWS accounts. Having one monitoring account is like having a single screen where you can see all the channels simultaneously. It centralizes control, giving you a unified view of your AWS environment across regions and accounts. This way, you're not flipping back and forth, missing critical alerts or patterns.
Simplified Security and Compliance: Keeping your security and compliance checks in one place makes it easier to ensure everything's up to snuff. It's like having one secure vault where all your essential documents are stored rather than scattered in different drawers. With a single monitoring account, you can apply uniform security measures and have a consolidated audit trail, which is a huge relief during compliance audits.
Efficient Resource Management: Managing resources and permissions across multiple accounts can be a logistical nightmare. By funneling all monitoring tasks through one account, you have a single panel for this process. It's akin to having one remote control for all your devices - less clutter more efficiency.
Cost-Effective: Having all your monitoring tools and resources in one place is generally more cost-effective. Think of it as buying in bulk – often, it's cheaper than getting bits and pieces separately.
Log Analysis and Visualization: You can leverage advanced log analysis and visualization tools more effectively with all your logs in one place. These tools can sift through mountains of data to highlight trends, anomalies, and insights that might be missed otherwise. It's like having a superpowered magnifying glass that shows you the details and helps you understand the bigger picture.
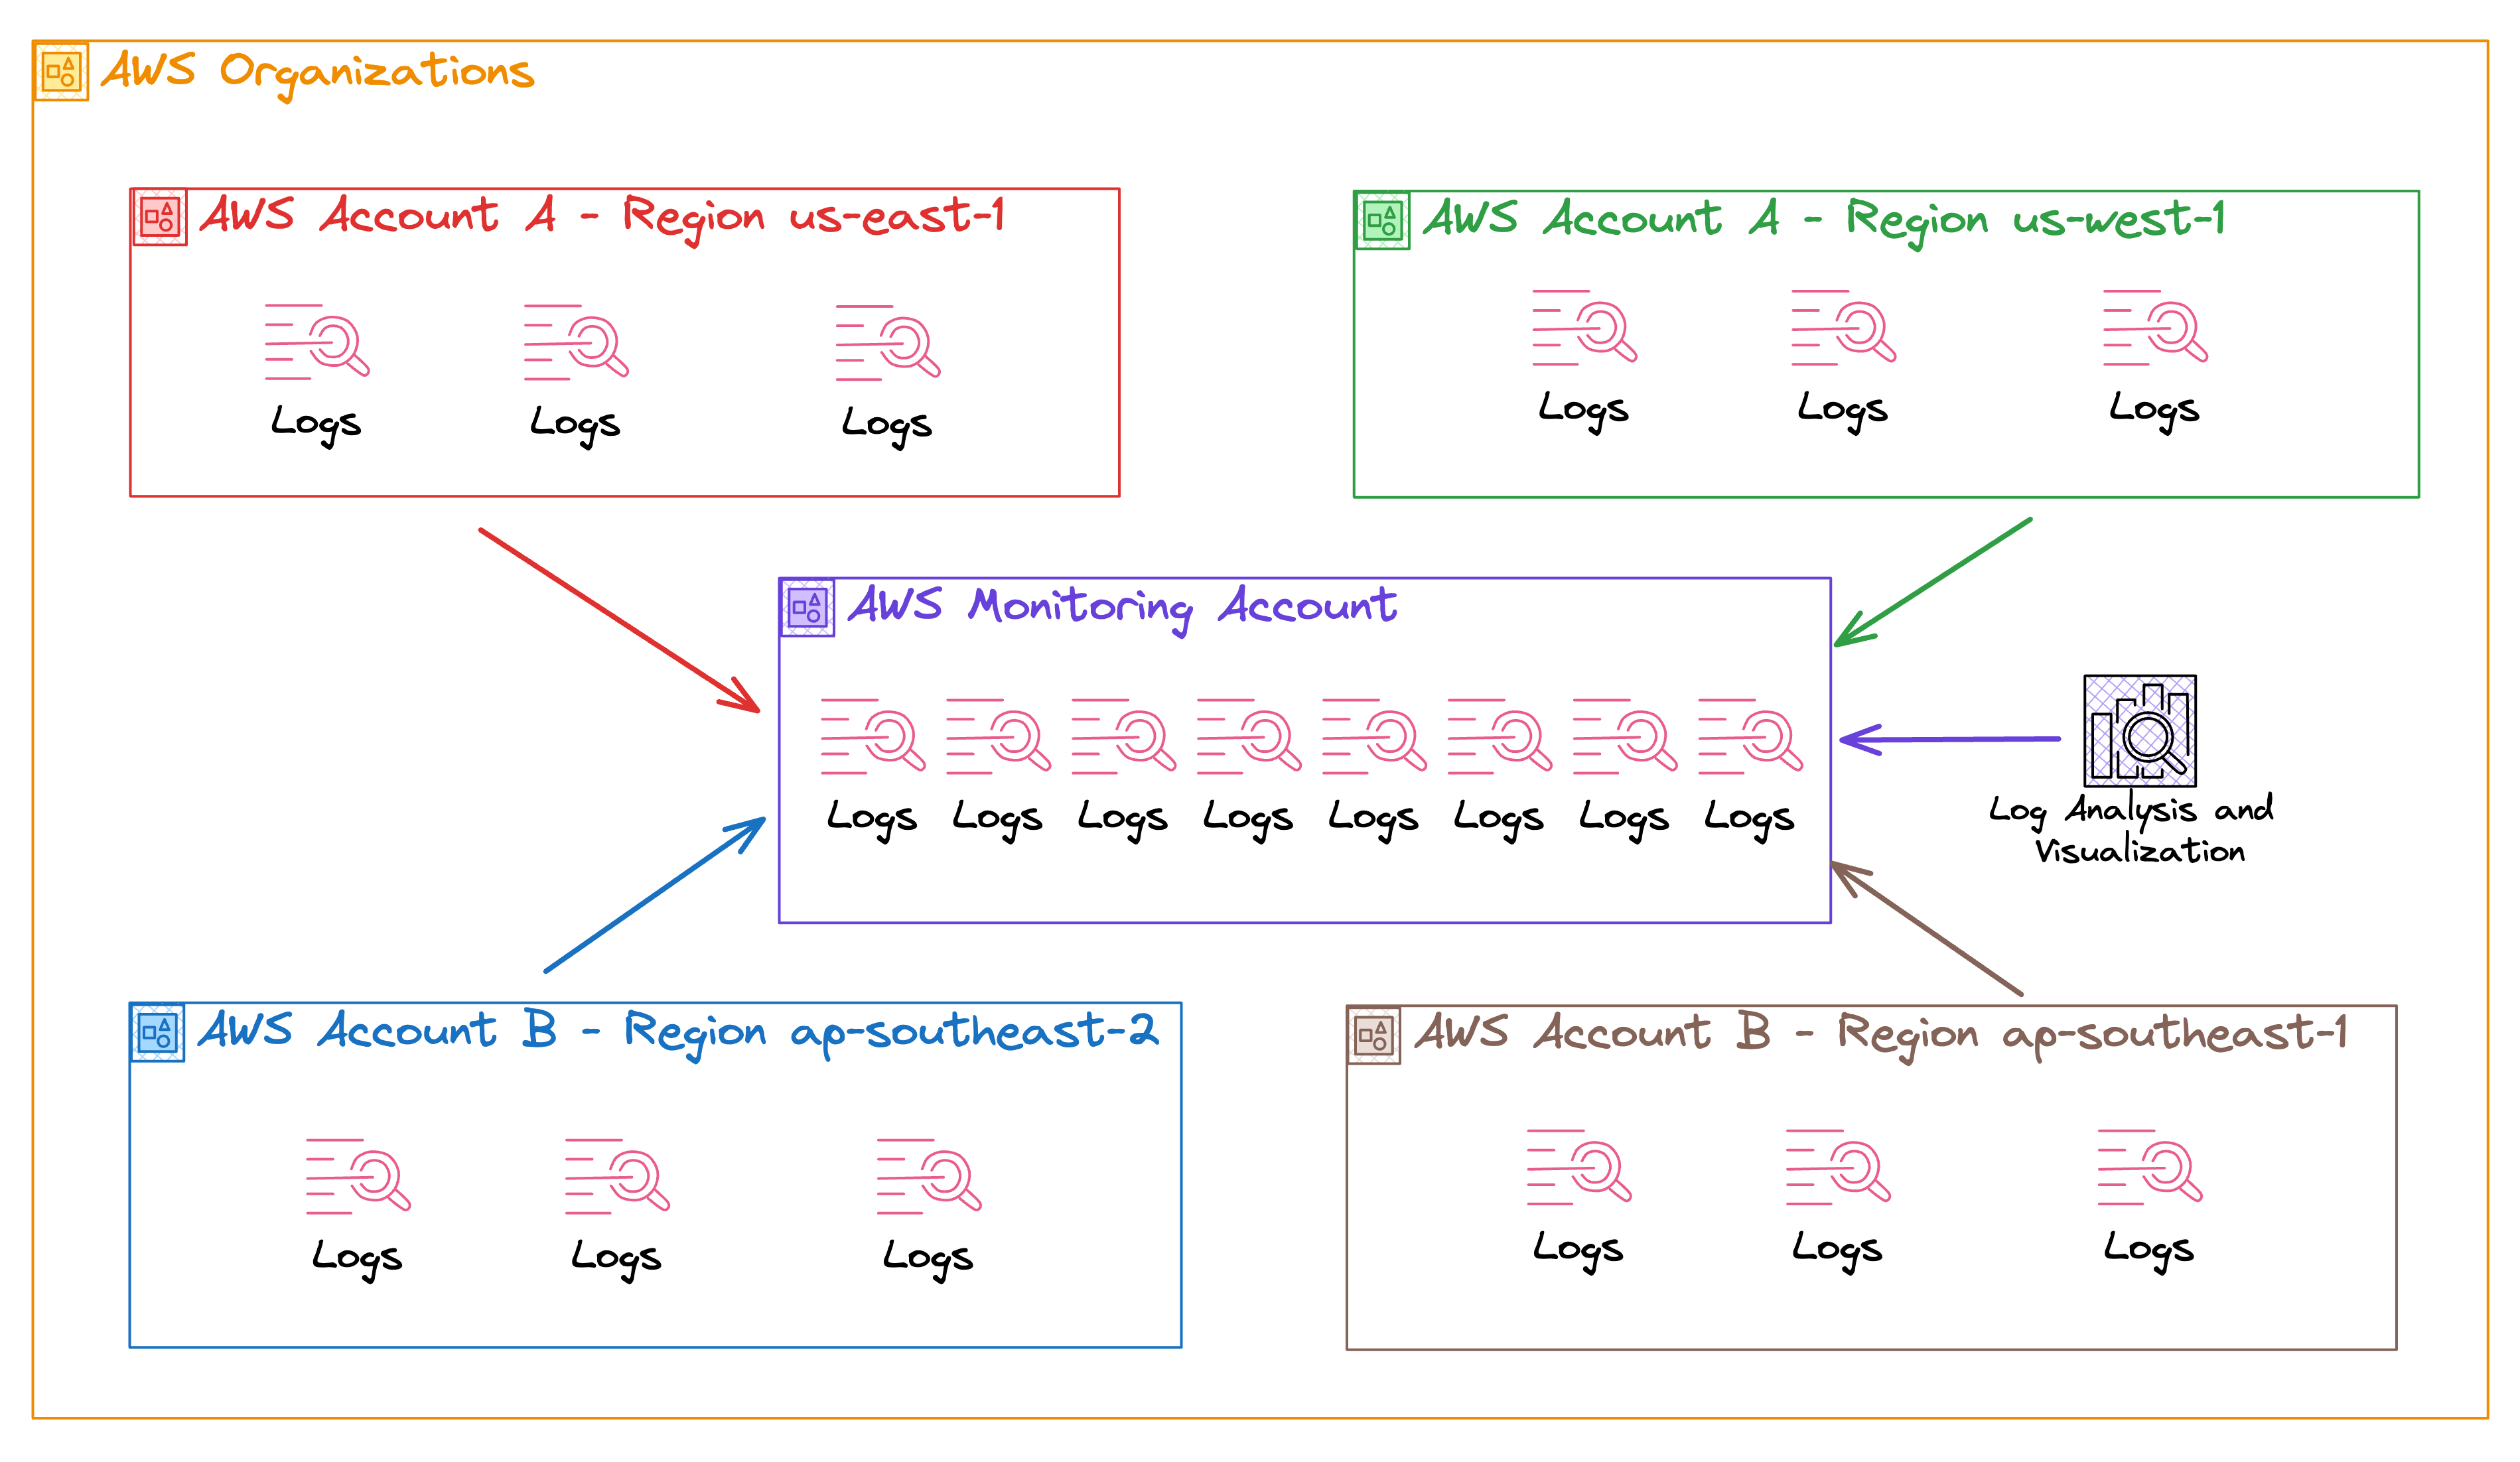
How do we go from our multi-account, multi-region sprawl to this neat, centralized monitoring setup? It starts with choosing the correct account to be your monitoring hub. This account should be secure and limited regarding who has access to it. Think of it as your mission control center – only key personnel get in.
Finally, start funneling your logs and metrics into this account. AWS provides mechanisms like cross-account roles and access to make this part smoother. Remember, the goal is to have a single pane of glass where you can see everything happening in your application environment.
Transitioning to a single monitoring account might feel like a significant shift, but it's like upgrading from a cluttered desk with papers everywhere to a sleek, organized workspace. Everything you need is still there – it's easier to find and manage.
Does CloudWatch offer a native solution for cross-account and cross-region aggregation?
Considering that we have different solutions for different CloudWatch services and purposes. AWS prescriptive guidance with native solutions are:
1)Cross-account cross-Region CloudWatch console: You can create cross-account and cross-region visibility to your dashboards, alarms, metrics, and automatic dashboards. You designate an account as the centralized monitoring account and define source accounts to share their data. The source accounts can:
Provide read-only access to their CloudWatch metrics, dashboards, and alarms: Enable the monitoring account to create cross-account dashboards that include widgets that contain CloudWatch data from the source account.
Include CloudWatch automatic dashboards: Enable the monitoring account to view the information in the source account's automatic dashboards.
Include X-Ray read-only access for ServiceLens: Enable the monitoring account to view the ServiceLens service map and X-Ray trace information in the source account.
Full read-only access to everything: Enable the monitoring account to create cross-account dashboards with widgets containing CloudWatch data from the source account CloudWatch and other AWS services.
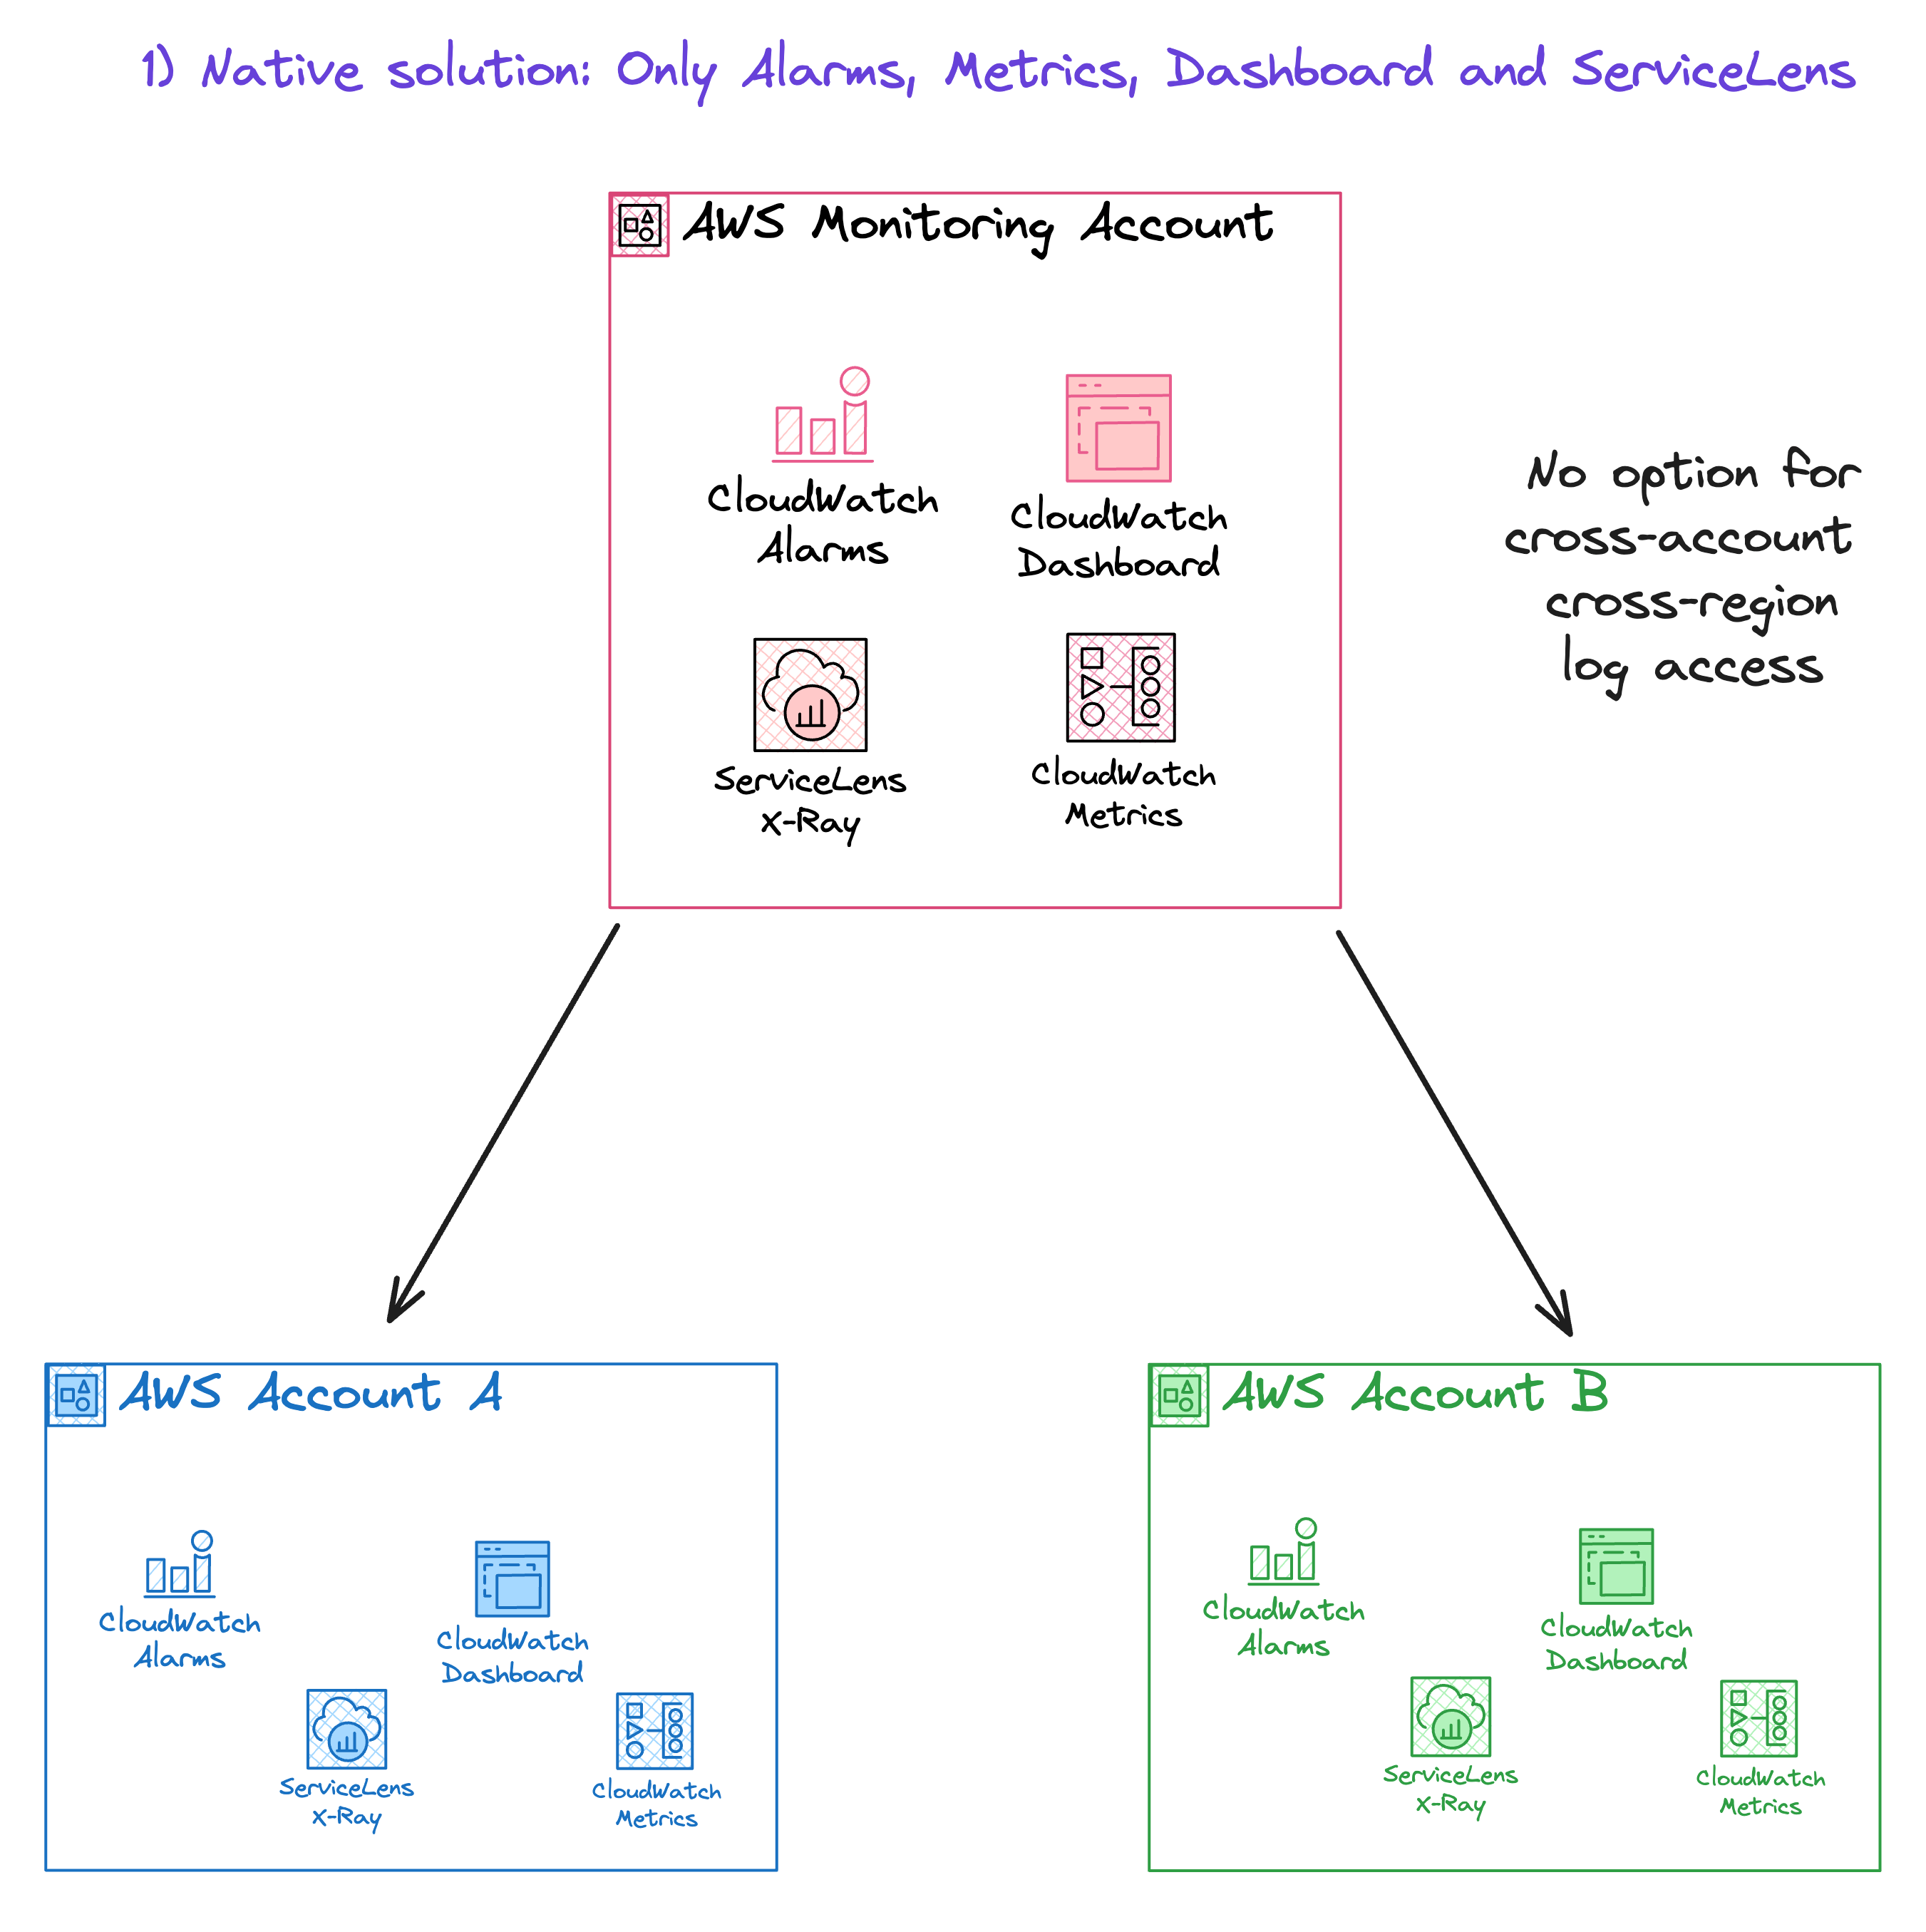
This approach allows metrics, alarms, and dashboard widgets to be shared and centralized in a single region within a monitoring account. However, this method does have a drawback: your logs are not included in this centralized system.
2)CloudWatch cross-account observability: You can create cross-account single-region-to-region share of metrics, log groups, traces, and application insights. Observability Access Manager was released in Nov 2022 and allows you to link your metrics, log groups, traces, and application insights from one region in the source account to the same region in the monitoring account.
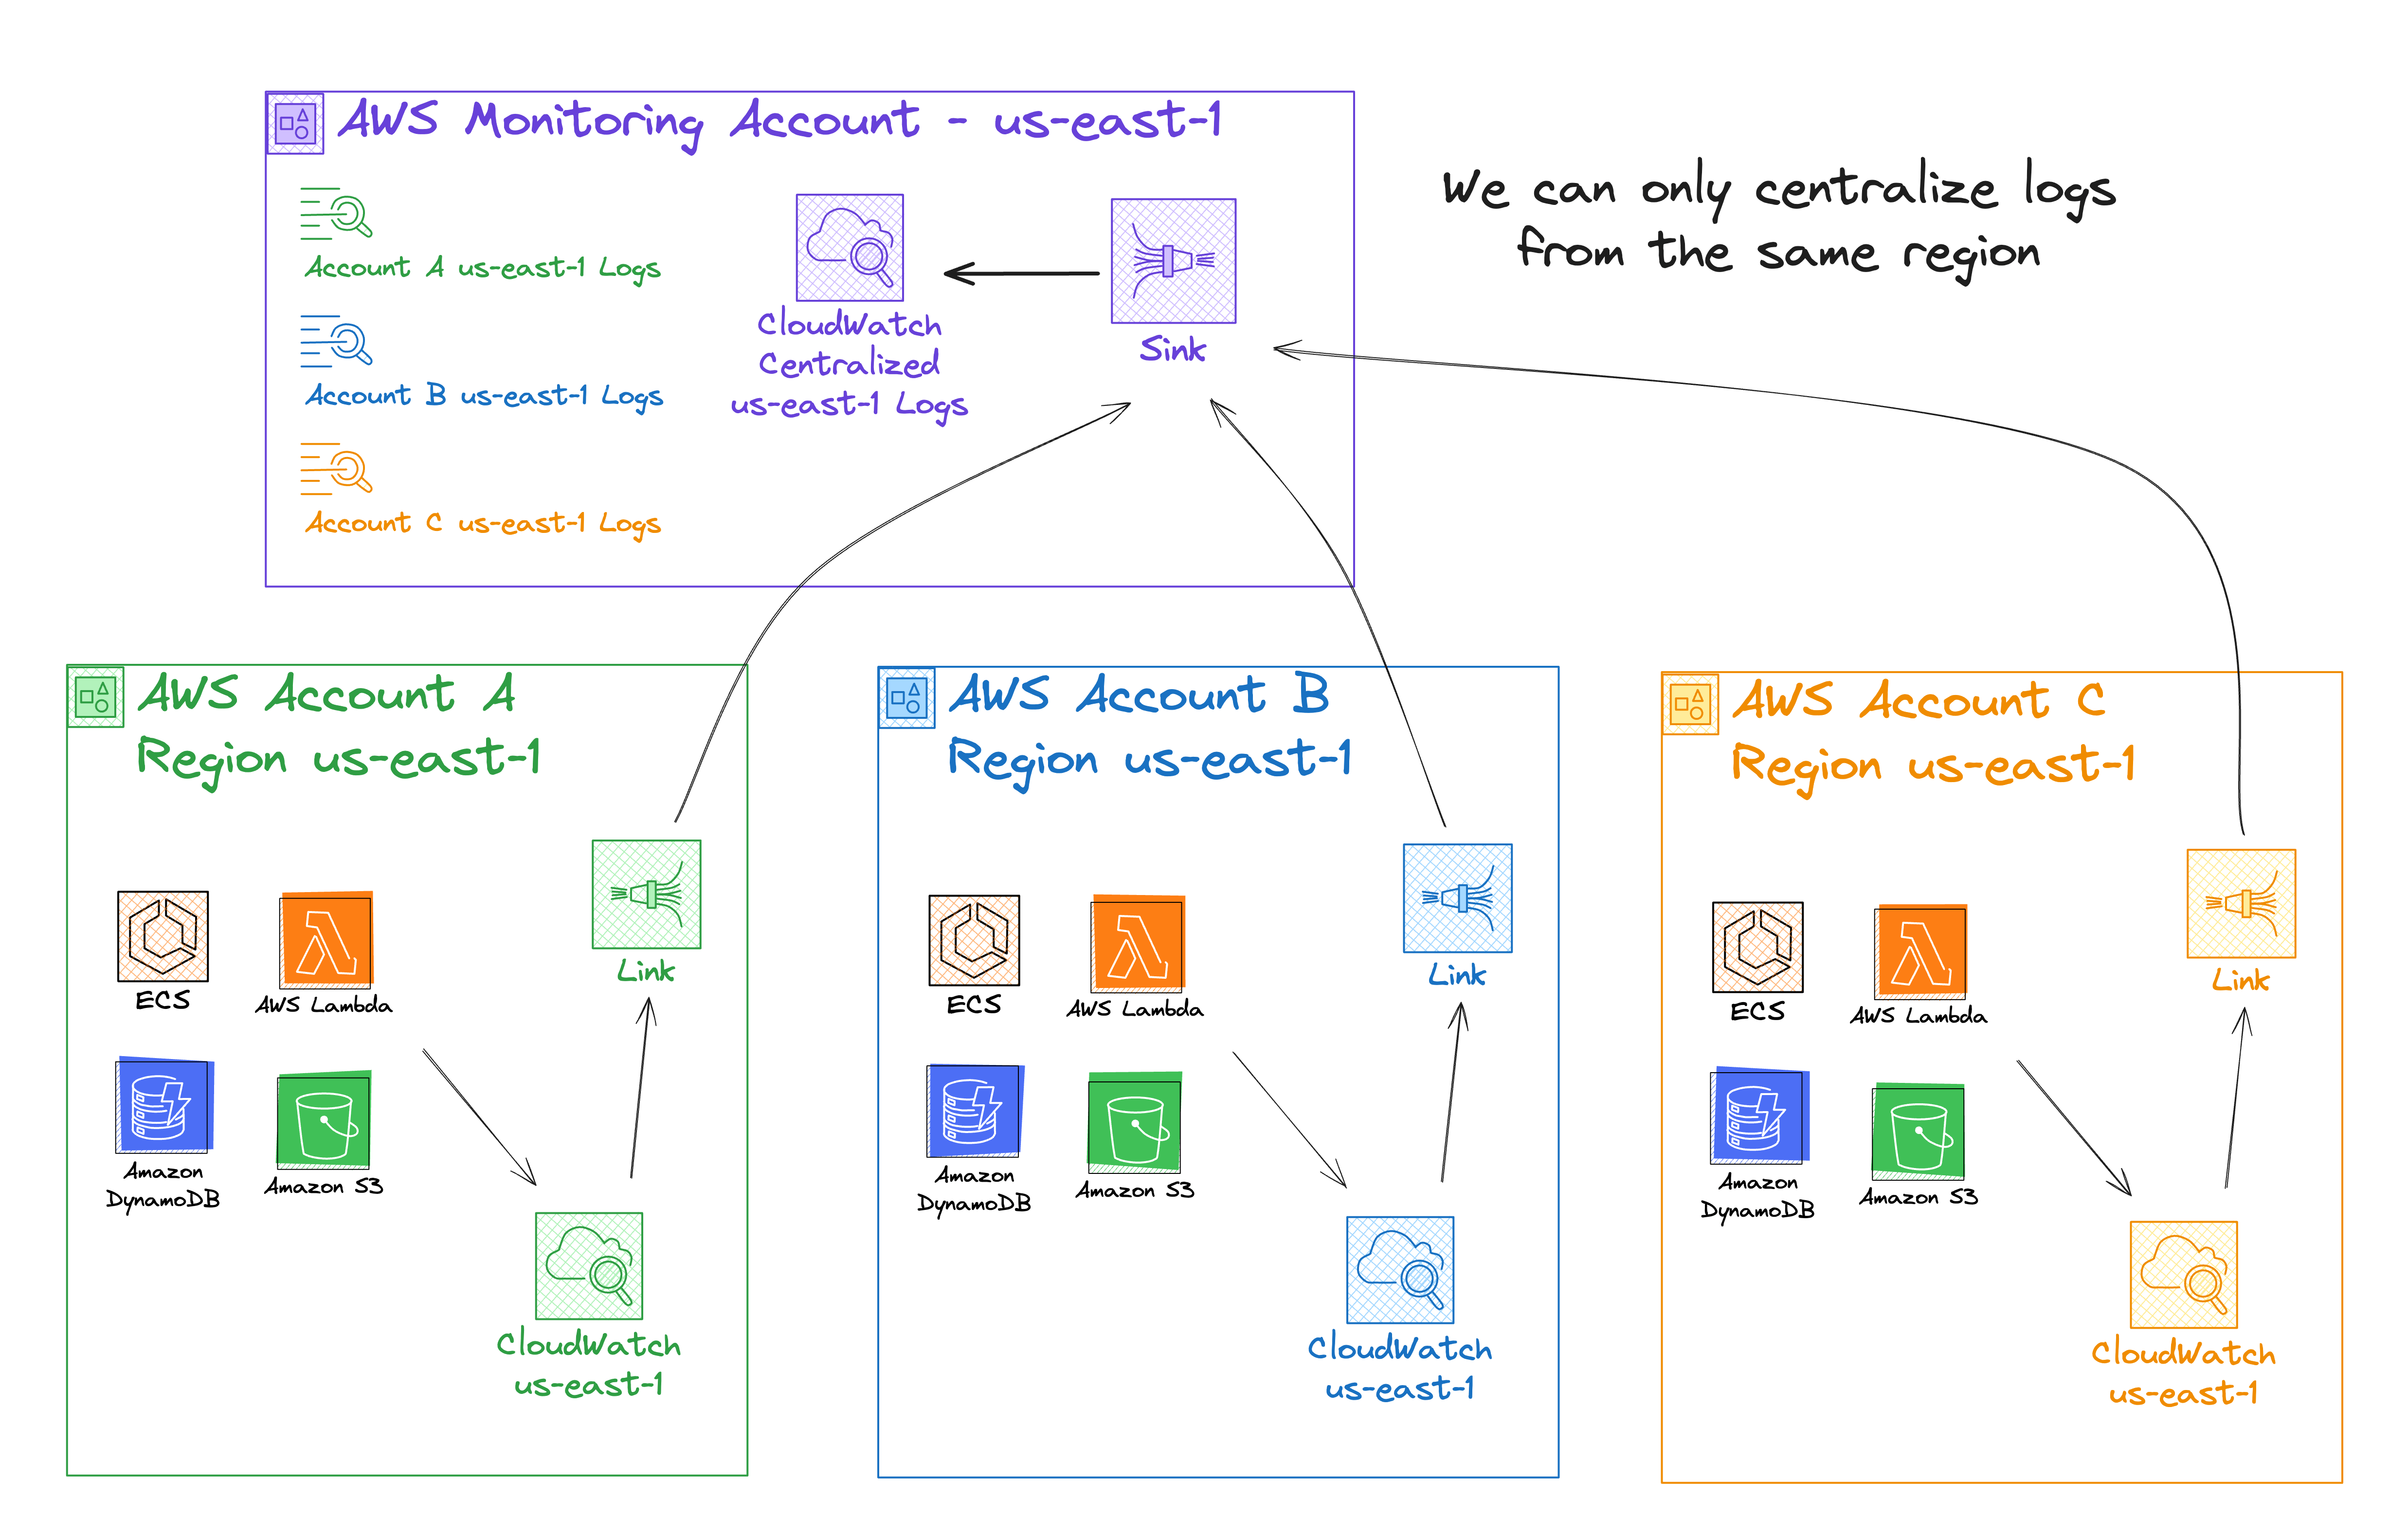
A sink is a resource representing the target point in a monitoring account. Source accounts can link to the sink to share observability data. The monitoring account manages each sinkin the region in which it was created.
A link is a resource that represents the data sharing established between a source account and a monitoring account. The source account manages its links in the region it was created.
While this approach offers a plug-and-play solution to ingest logs from one region to a centralized account using the same region, it doesn't enable you to aggregate logs into a single region from different regions in different accounts.
So, now what, no native solution, what do I do?
Third-party and open-source solutions for cross-account and cross-region log aggregation
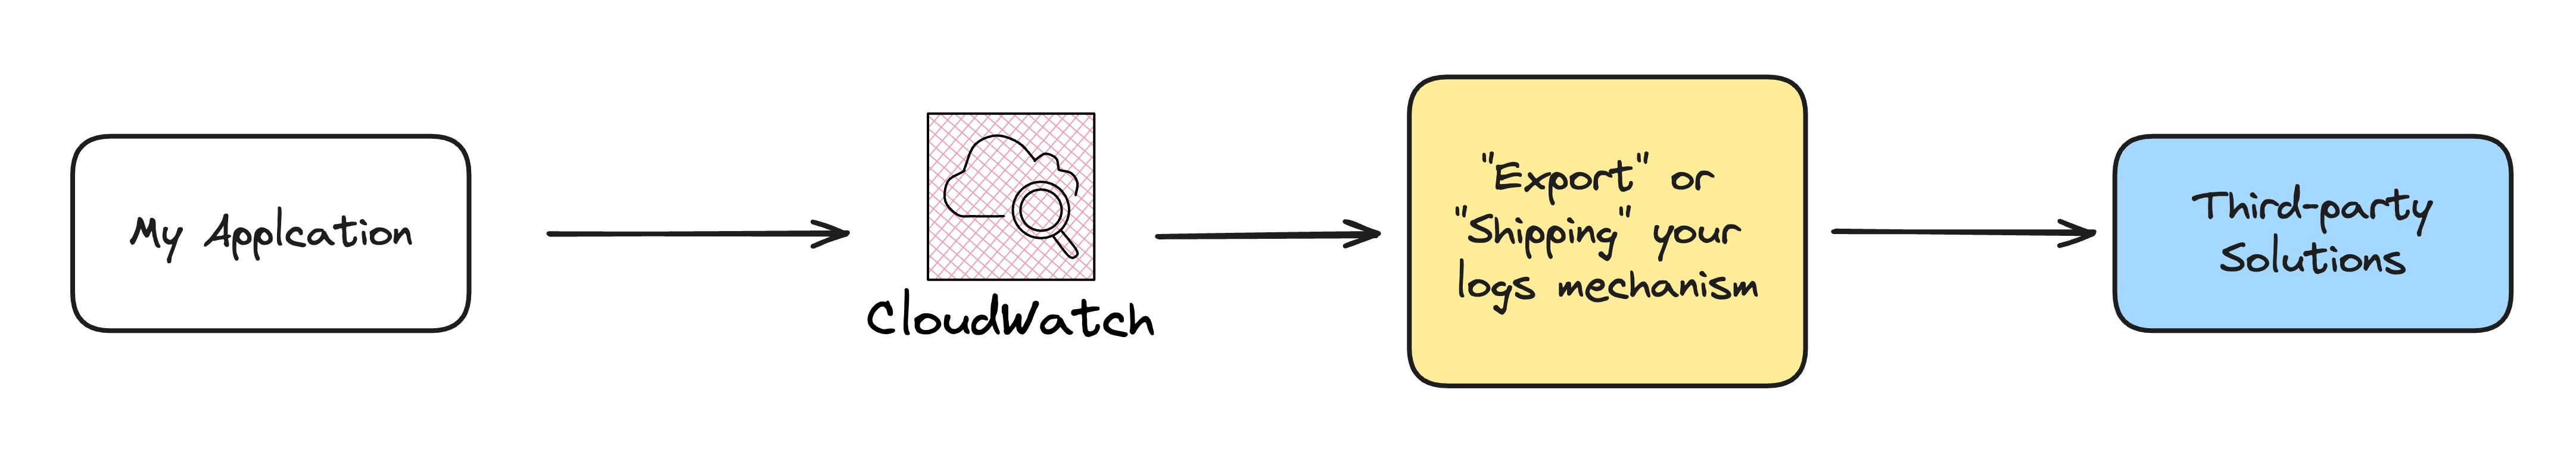
While working in the industry, you will encounter third-party solutions for monitoring and observability, like New Relic, DataDog, and Lumigo. These third-party solutions advocate "exporting" or "shipping" your logs from CloudWatch to their platform.
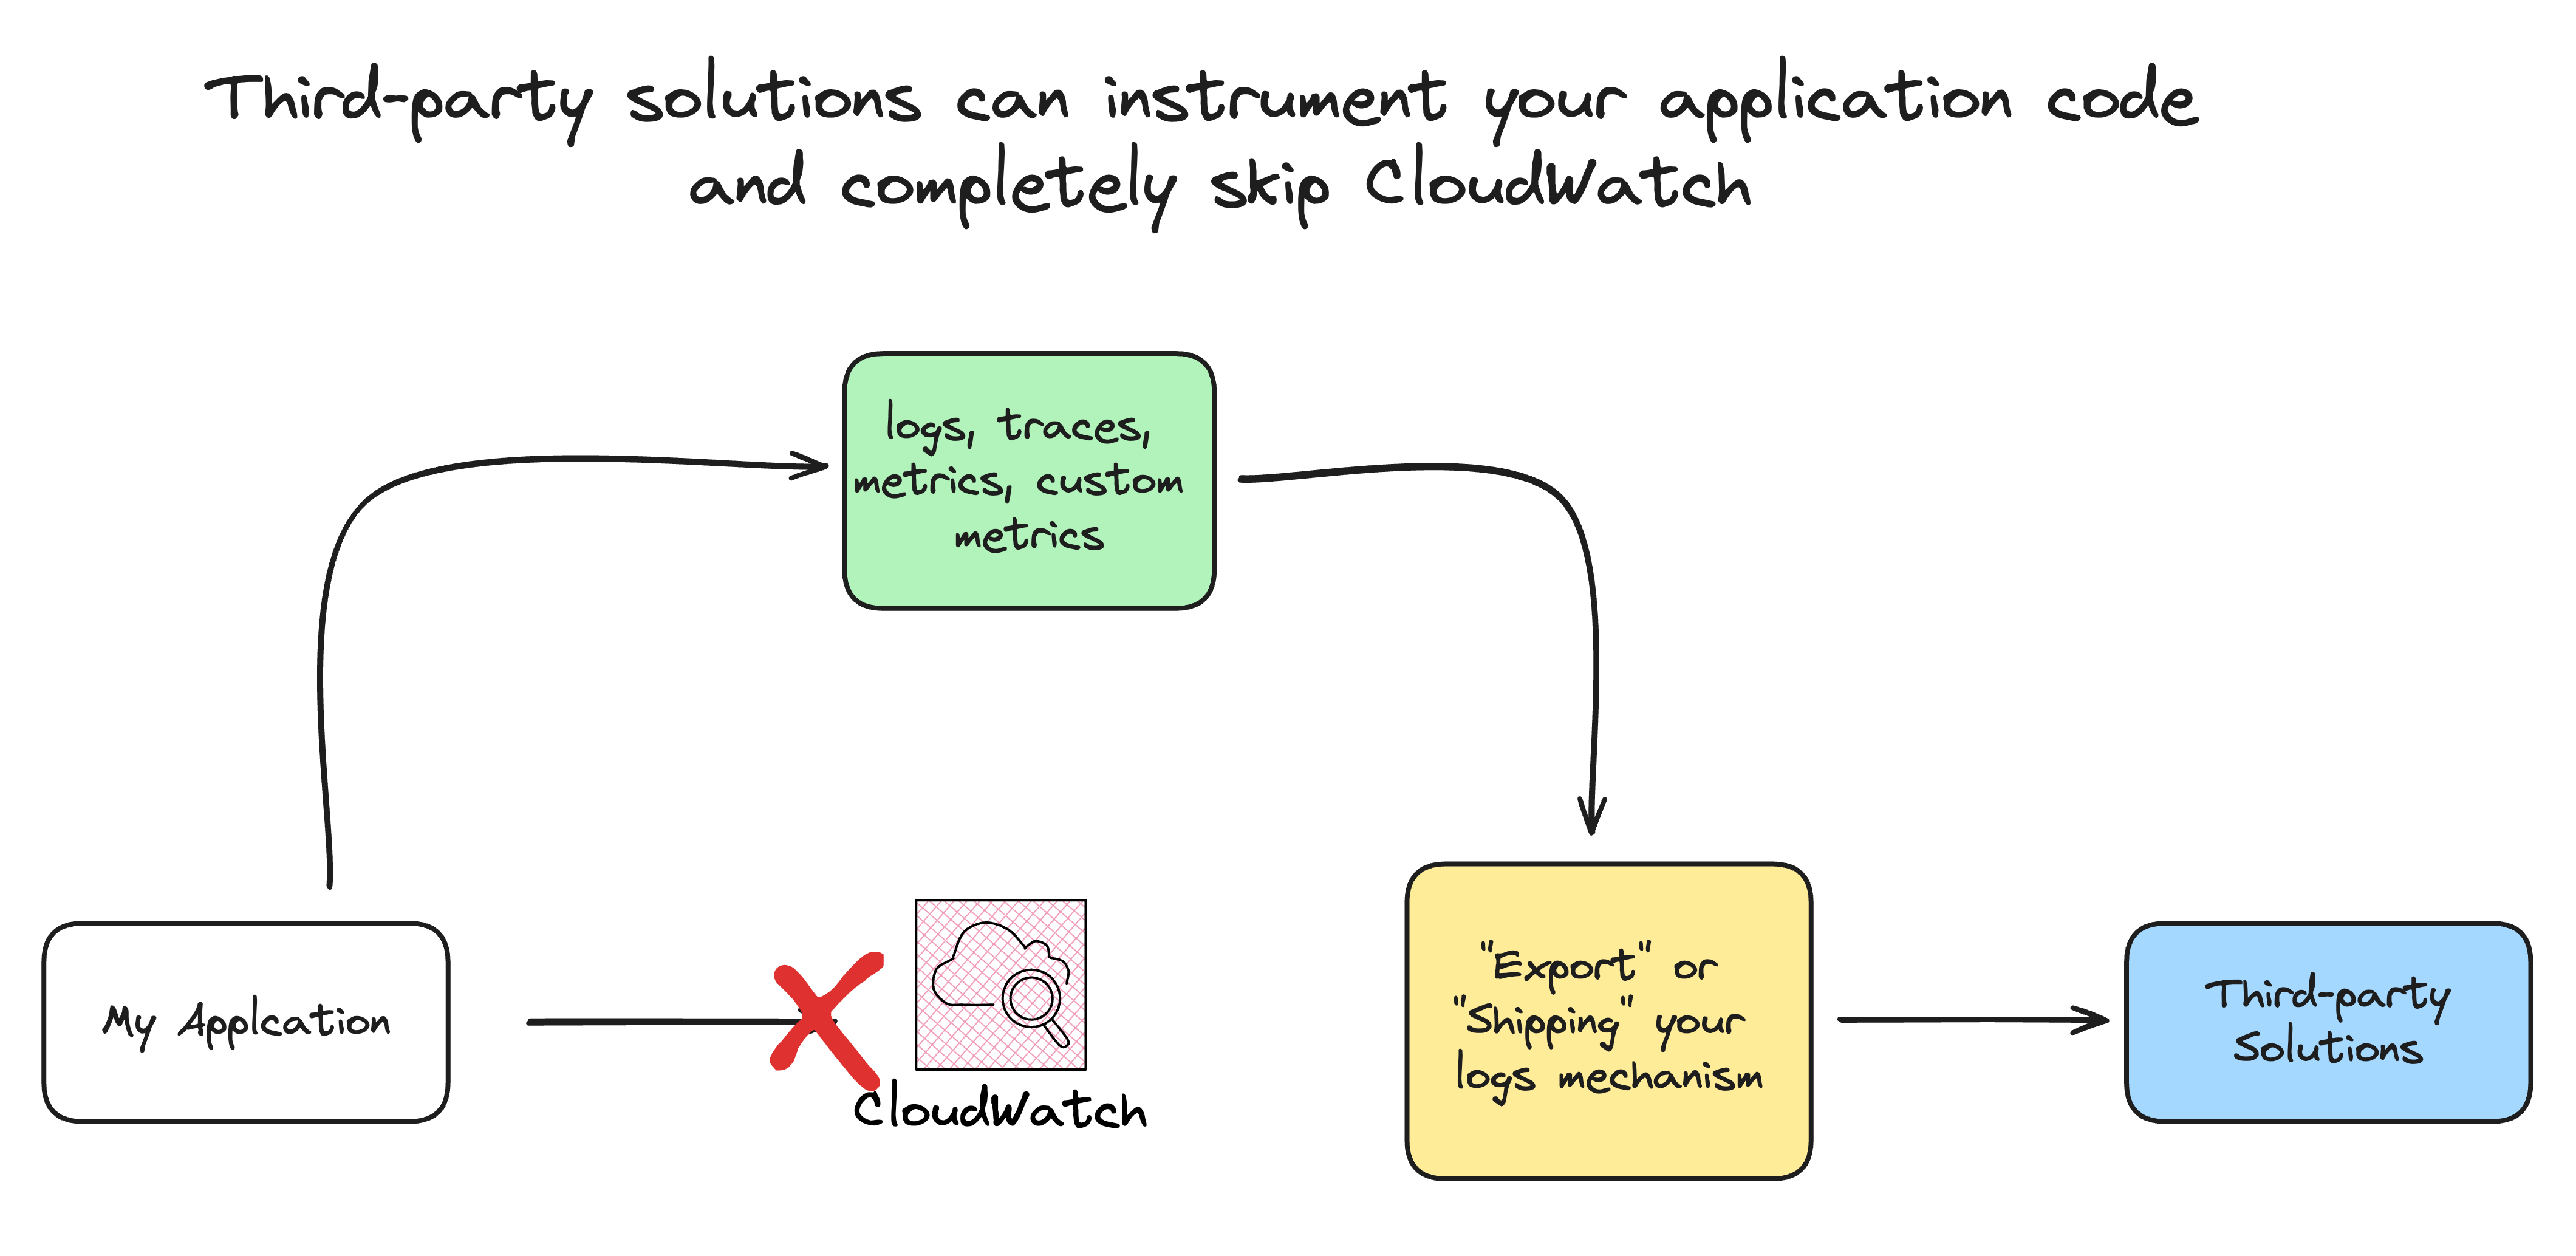
They also offer solutions to send logs, traces, and metrics directly from your application code by installing their third-party code package in your source code. This is called application instrumentation. Example in DataDog documentation.
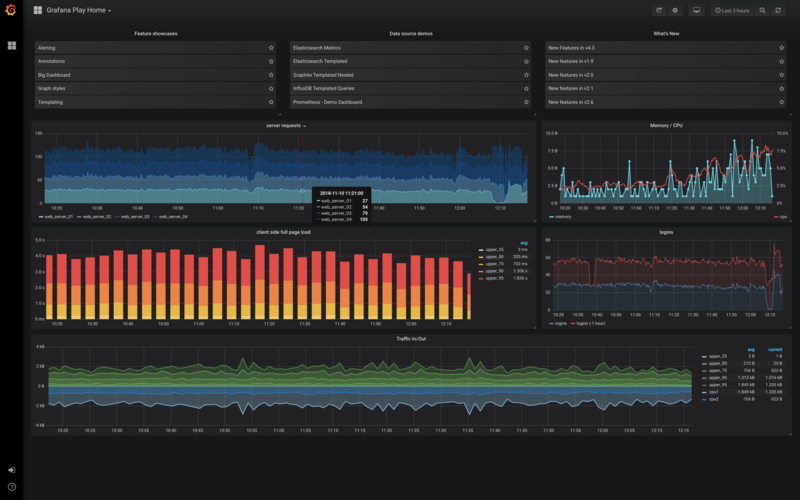
We have open-source tools with managed AWS versions, achieving the same goal. A typical combination is Grafana with Prometheus and ElasticSearch/OpenSearch with Kibana. They also require you to export your logs to their indexes in a specific format.
AWS Serverless Hero Ran Isenberg, Principal Software Architect at CyberArk, wrote an in-depth article about many serverless options to export your CloudWatch Logs to third-party software: Export CloudWatch Logs to Third-party Observability Tools with Serverless.
Many AWS users have encountered this exact situation, and AWS offers pre-made solutions trying to address that.
1)AWS Observability Accelerator for Terraform
The AWS Observability Accelerator for Terraform is a set of opinionated modules to help you set up observability for your AWS environments with AWS-managed observability services such as Amazon Managed Service for Prometheus, and Amazon Managed Grafana, AWS Distro for OpenTelemetry (ADOT) and Amazon CloudWatch.
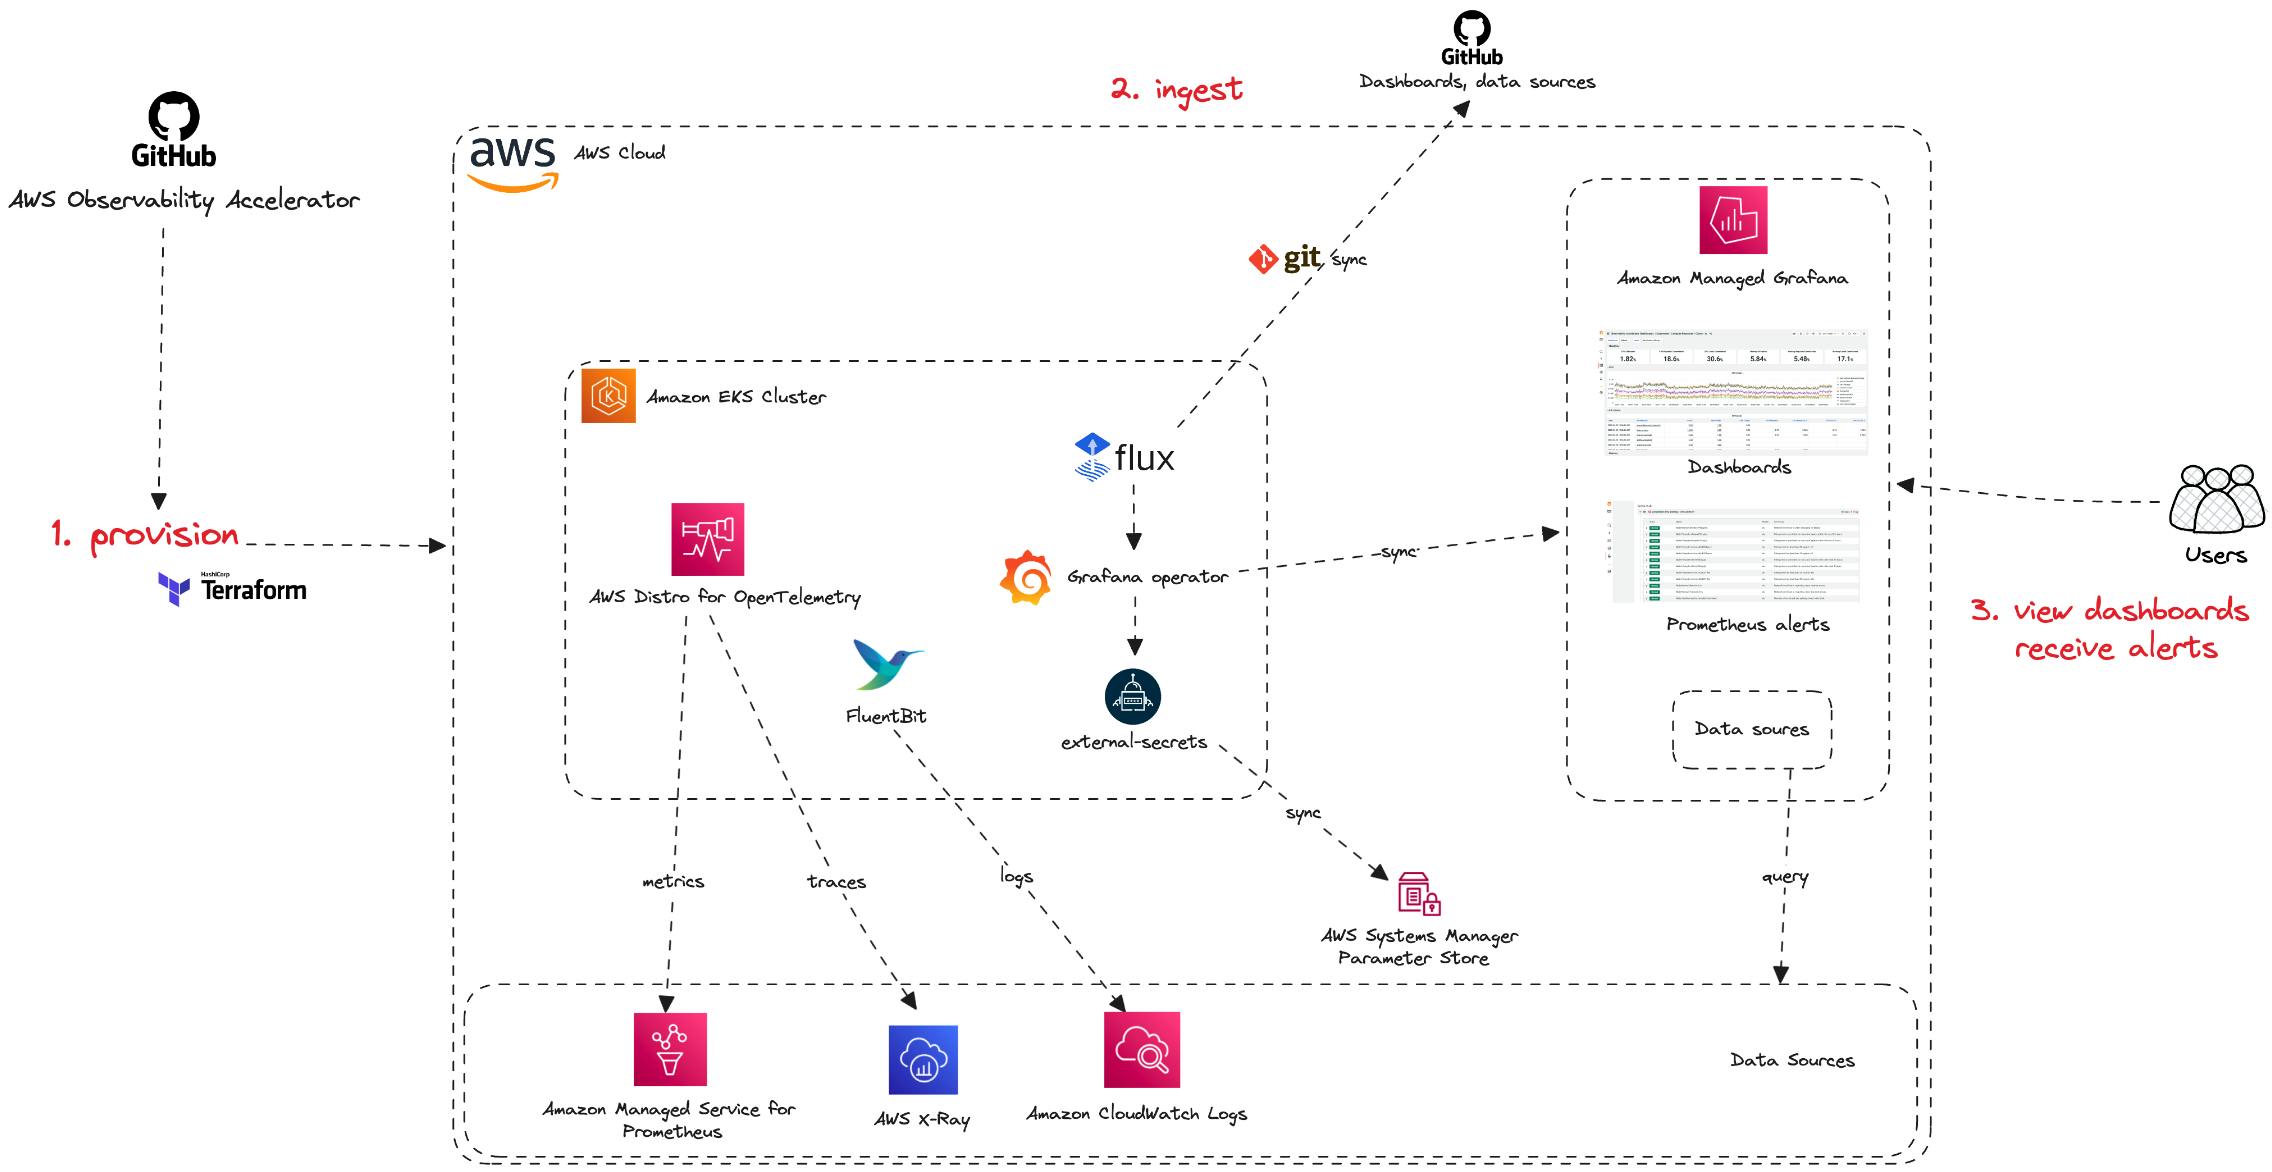
This solution uses Grafana and Prometheus for log ingestion, analysis, visualization, and alarms. Your application is instrumented with AWS Distro for OpenTelemetry, and examples for ECS and EKS are available on GitHub.
2)Centralized Logging with OpenSearch
The AWS Solutions Library offers Centralized Logging with OpenSearch. Using OpenSearch, you can collect, analyze, and display logs in a single dashboard.

The solution has the following features:
All-in-one log ingestion: provides a single web console to ingest both application and AWS service logs into the Amazon OpenSearch (AOS) domains.
Codeless log processor: supports log processor plugins developed by AWS. You can enrich the raw log data through a few clicks on the web console.
Out-of-box dashboard template: offers a collection of reference designs of visualization templates for both commonly used software such as Nginx and Apache HTTP Server and AWS services such as Amazon S3 and Amazon CloudTrail.
Unfortunately, these examples are convoluted. They do not separate the parts necessary for log ingestion, analysis, and visualization. We have sample applications to showcase the end-to-end solution working, but they are unnecessary for what we are looking for.
While they somewhat accomplish what we want: centralized logs from multiple accounts and regions in a single region in the monitoring account. By using managed versions of OpenSearch, Grafana, or Prometheus, we have a 24/7 operational cost for running the domain and clusters.
Looking at the breakdown of the costs for the OpenSearch solution, you can understand the minimum monthly costs.
Can we isolate only the log ingestion, analysis, and visualization?
What would that look like?
The open-source solution by itprosource offers precisely that.
3)Terraform Centralized Logging Solution
This Terraform module deploys a VPC-hosted OpenSearch cluster, using Cloudwatch Destinations/Kinesis Data stream to ingest data, pass through a Lambda function which transforms data into OpenSearch-readable format, then pipes formatted data through Kinesis Firehose before depositing logs in the OpenSearch cluster.

Oh my! One step in the right direction, I guess! However, we are still using OpenSearch and paying the cluster costs.
We can deploy this solution in our monitoring account. For every other account and region running our applications, we export their logs to the centralized Kinesis Data Stream using CloudWatch Destinations.
CloudWatch Destinations are endpoints for cross-account cross-region support for the CloudWatch Logs Log Subscription Filter. Kinesis Data Stream didn't support a resource-based policy.
This has now been fixed with the Kinesis release last week. You can attach a resource policy in your Kinesis Data Stream to allow cross-account and cross-region access.
CloudWatch does offer solutions for log ingestion, analysis, and visualization.
Can't we build something with it?
Custom CloudWatch solution for cross-account and cross-region log aggregation
At this point, a few things are clear:
We can share metrics, alarms, and dashboards cross-account and cross-region natively using CloudWatch
There's no native solution from CloudWatch to aggregate cross-region cross-account logs into a monitoring account in a single region.
Third-party and open-source solutions require exporting and transforming your logs to a specific destination and schema. You instrument each source account to export logs to a target account.
We can export logs to different accounts and regions using CloudWatch Destinations and Kinesis Data Stream with Log Subscription Filter.
What if we use these ideas and use CloudWatch as a target destination?
We export and transform our logs, but instead of Grafana or DataDog, we send them to another CloudWatch.
Can we export the logs from all accounts and regions to the monitoring account CloudWatch in a single region?
If there's a will, there's a way!
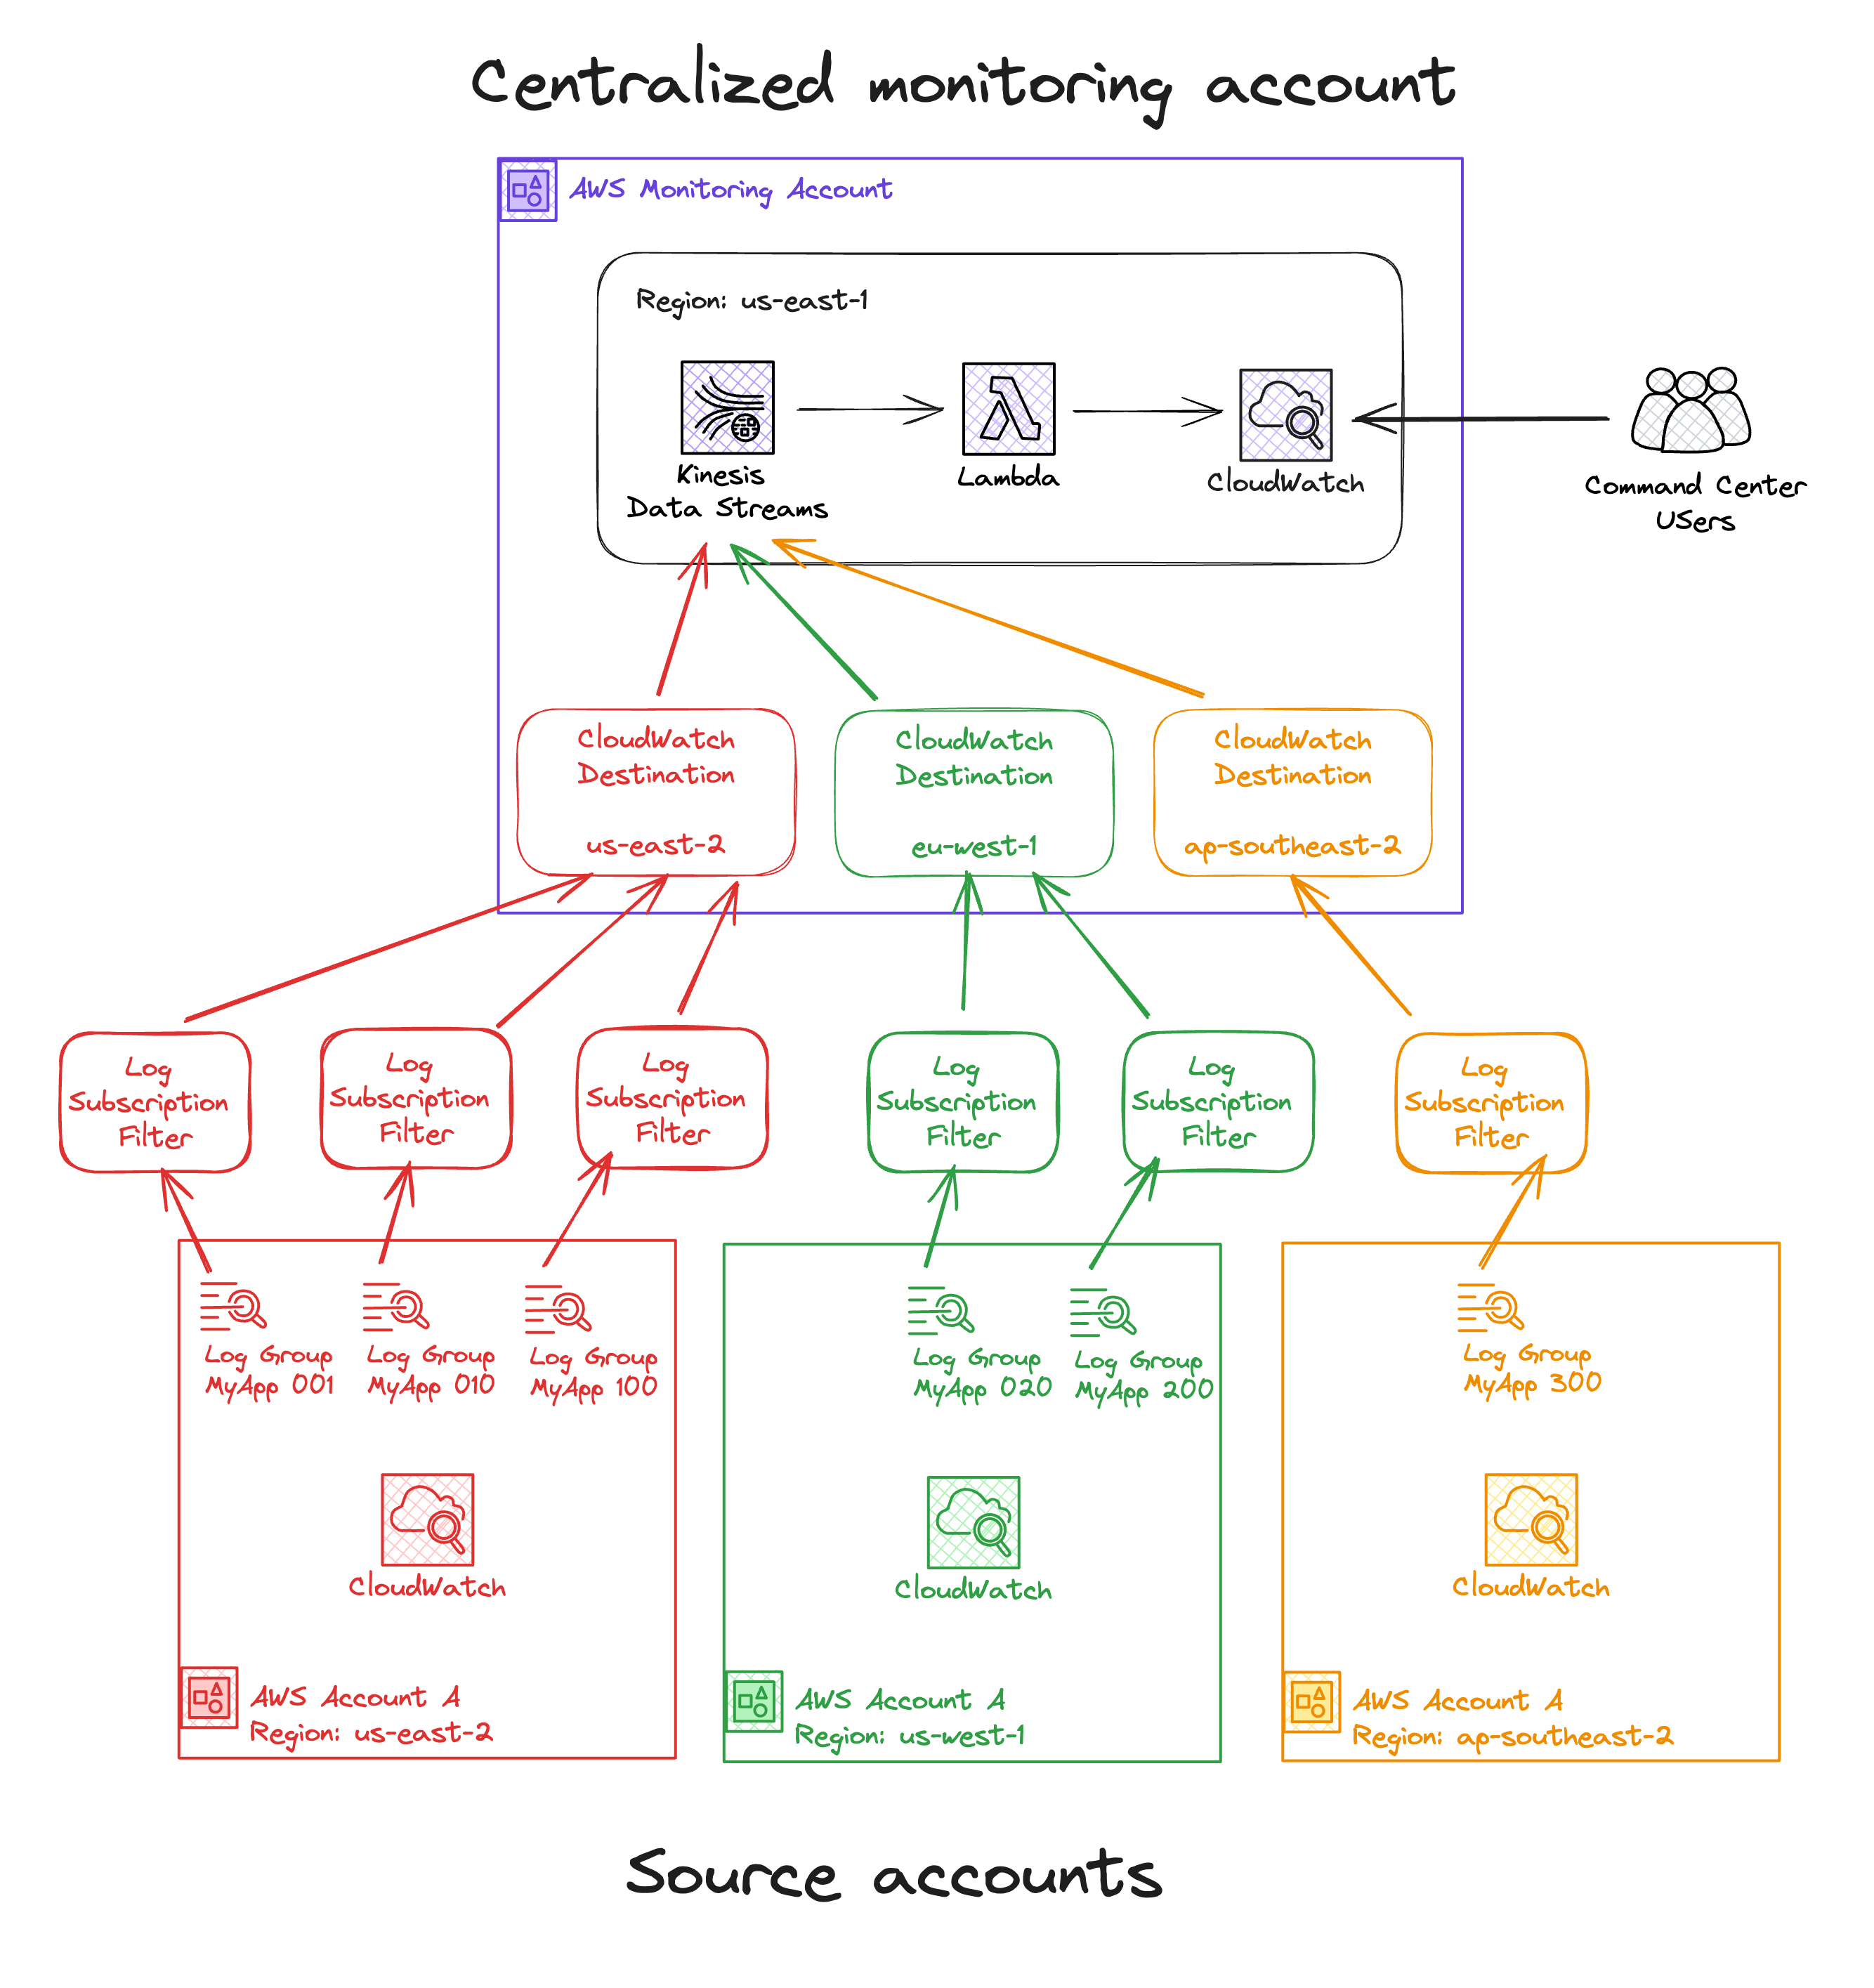
The solution Ed Eastwood proposes in his guide Centralised Logs and Alarms from Multiple AWS Accounts and Aidan Steele talks about in his article Centralised logging: from CloudWatch to Kinesis Firehose, are precisely what we are looking for!
Export CloudWatch Logs from multiple accounts and regions into a single region in a monitoring account
Using CloudWatch Destinations and Kinesis Data Stream for log ingestion
AWS Lambda to re-create the log stream, group, and events in the monitoring accounts for log analysis and visualization
Ed Eastwood goes even further. Using the features discussed in the first sections, he used CloudWatch native integration to share metrics, dashboards, and alarms with a monitoring account. He only deployed the custom log forwarding using CloudWatch Destinations and Kinesis Data Streams.
In his words:
In complex environments, it’s easy to lose track of alarms distributed across many accounts. Proliferation of alarms can lead to:
Time wasted handling false positive alarms
Delayed resolution of genuine incidents lost in the noise, and
Inconsistent alarms across source accounts.
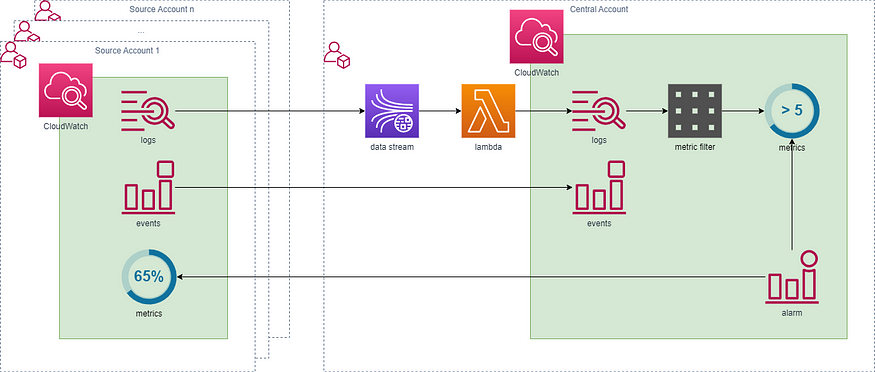
The solution makes logs, events and metrics available to a single central account from multiple source accounts. These can then be used to trigger alarms or integrate with third-party systems via SNS or EventBridge.
Logs are streamed through Kinesis Data Streams, ingested into CloudWatch, and can be the subject of metric filters in the central account
Events are pushed using cross-account delivery (Sending and Receiving Events Between AWS Accounts — Amazon CloudWatch Events)
Metrics remain in the source account but are made visible to the central account using cross-account cross-region metrics (Cross-account cross-Region CloudWatch console — Amazon CloudWatch). They can then be built into dashboards and trigger alarms in the central account.
Using this approach, we share all metrics, alarms, dashboards, and logs from different accounts and regions with a single monitoring account in a single region.
This enables us to use all AWS native integrations and CloudWatch features with aggregated values across multiple applications, regions, and accounts.
In each source account, a subscription filter is set up for every log group, determining where the logs are sent and defining a filter pattern to select specific logs for transmission to the central account.
One strategy to minimize expenses is to filter out lower log levels like TRACE, DEBUG, and possibly INFO, depending on the intended use of the centralized monitoring account.
One critical CloudWatch Logs quota to be aware of is that each log group can have a maximum of two subscription filters. This quota can't be changed.
These logs are then forwarded to a Kinesis Data Stream and processed by a Lambda function. Within this Lambda function's context, the names of the source log group and stream are included, which are used to determine the appropriate target stream and log group in the monitoring account.
If the target stream or group does not exist, they are created, and the logs and timestamps are recorded without alteration. We can use the AWS SDK for the CloudWatch Logs Client to generate the target stream and group. For example, using the Node.js / JavaScript V3 SDK, we can combine CreateLogGroup, CreateLogStream, and PutLogEvents to achieve that.
To maintain clarity on the log's origins in the monitoring account, the log group names are prefixed with the ID of the source account. This method simplifies the identification of the logs based on their source account.
Here is a sample event from the Kinesis Data Stream connected with CloudWatch Destinations that the Lambda would receive.
{
  "messageType": "DATA_MESSAGE",
  "owner": "023456789123",
  "logGroup": "/aws/lambda/myapp",
  "logStream": "2023/11/26/[$LATEST]8c489ab97c89411589f3734d71e0e3c5",
  "subscriptionFilters": ["testDestination-ap-southeast-2"],
  "logEvents":
    [
      {
        "id": "37933458242749001690523697559704846723162893615065464832",
        "timestamp": 1700995097027,
        "message": "START RequestId: 3043ce0c-c477-49bd-aeba-d250acd5c3d2 Version: $LATEST\n",
      },
      {
        "id": "37933458242771302435722228182846382441435541976571445249",
        "timestamp": 1700995097028,
        "message": "2023-11-26T10:38:17.028Z\t3043ce0c-c477-49bd-aeba-d250acd5c3d2\tINFO\t{\n  \"key1\": \"value1\",\n  \"key2\": \"value2\",\n  \"key3\": \"value3\"\n}\n",
      },
    ],
}
As you can see, we have the source account in the owner key, the original log group name logGroup, the log stream name logStream, the subscription filter created in the source account, and the log events generated by that stream.
With that information, the Lambda in the monitoring account attached to the centralized Kinesis Data Stream can re-create the log group, stream, and events in the Monitoring account, using the Source Account ID as a prefix.
If you intend to aggregate logs exclusively for alerting purposes:
By default, log data is stored in CloudWatch Logs indefinitely. Configuring short data retention for your log groups in the monitoring account is advised to reduce data duplication and unnecessary costs.
You can create CloudWatch Metric filters to trigger CloudWatch Alarms indirectly from your CloudWatch Logs.
Metrics are not moved from the source accounts. Instead, access is provided for the central account.
Conclusion
In the fast-paced and expanding world of cloud computing observability, effectively aggregating logs across multiple AWS accounts and regions is crucial for maintaining a clear overview of your infrastructure, ensuring robust monitoring, and enhancing security and compliance.
Solutions like Grafana and Prometheus, AWS Observability Accelerator for Terraform, and Custom CloudWatch setup leveraging Kinesis Data Streams and Lambda functions are pivotal in this process, each offering unique advantages for centralized log management.
How are you adapting these approaches to fit your unique AWS environment? We're keen to hear your insights and learn about the creative strategies your team is employing to address this challenge.
Share your experiences and join the conversation! 🚀