


Infographic
Introduction
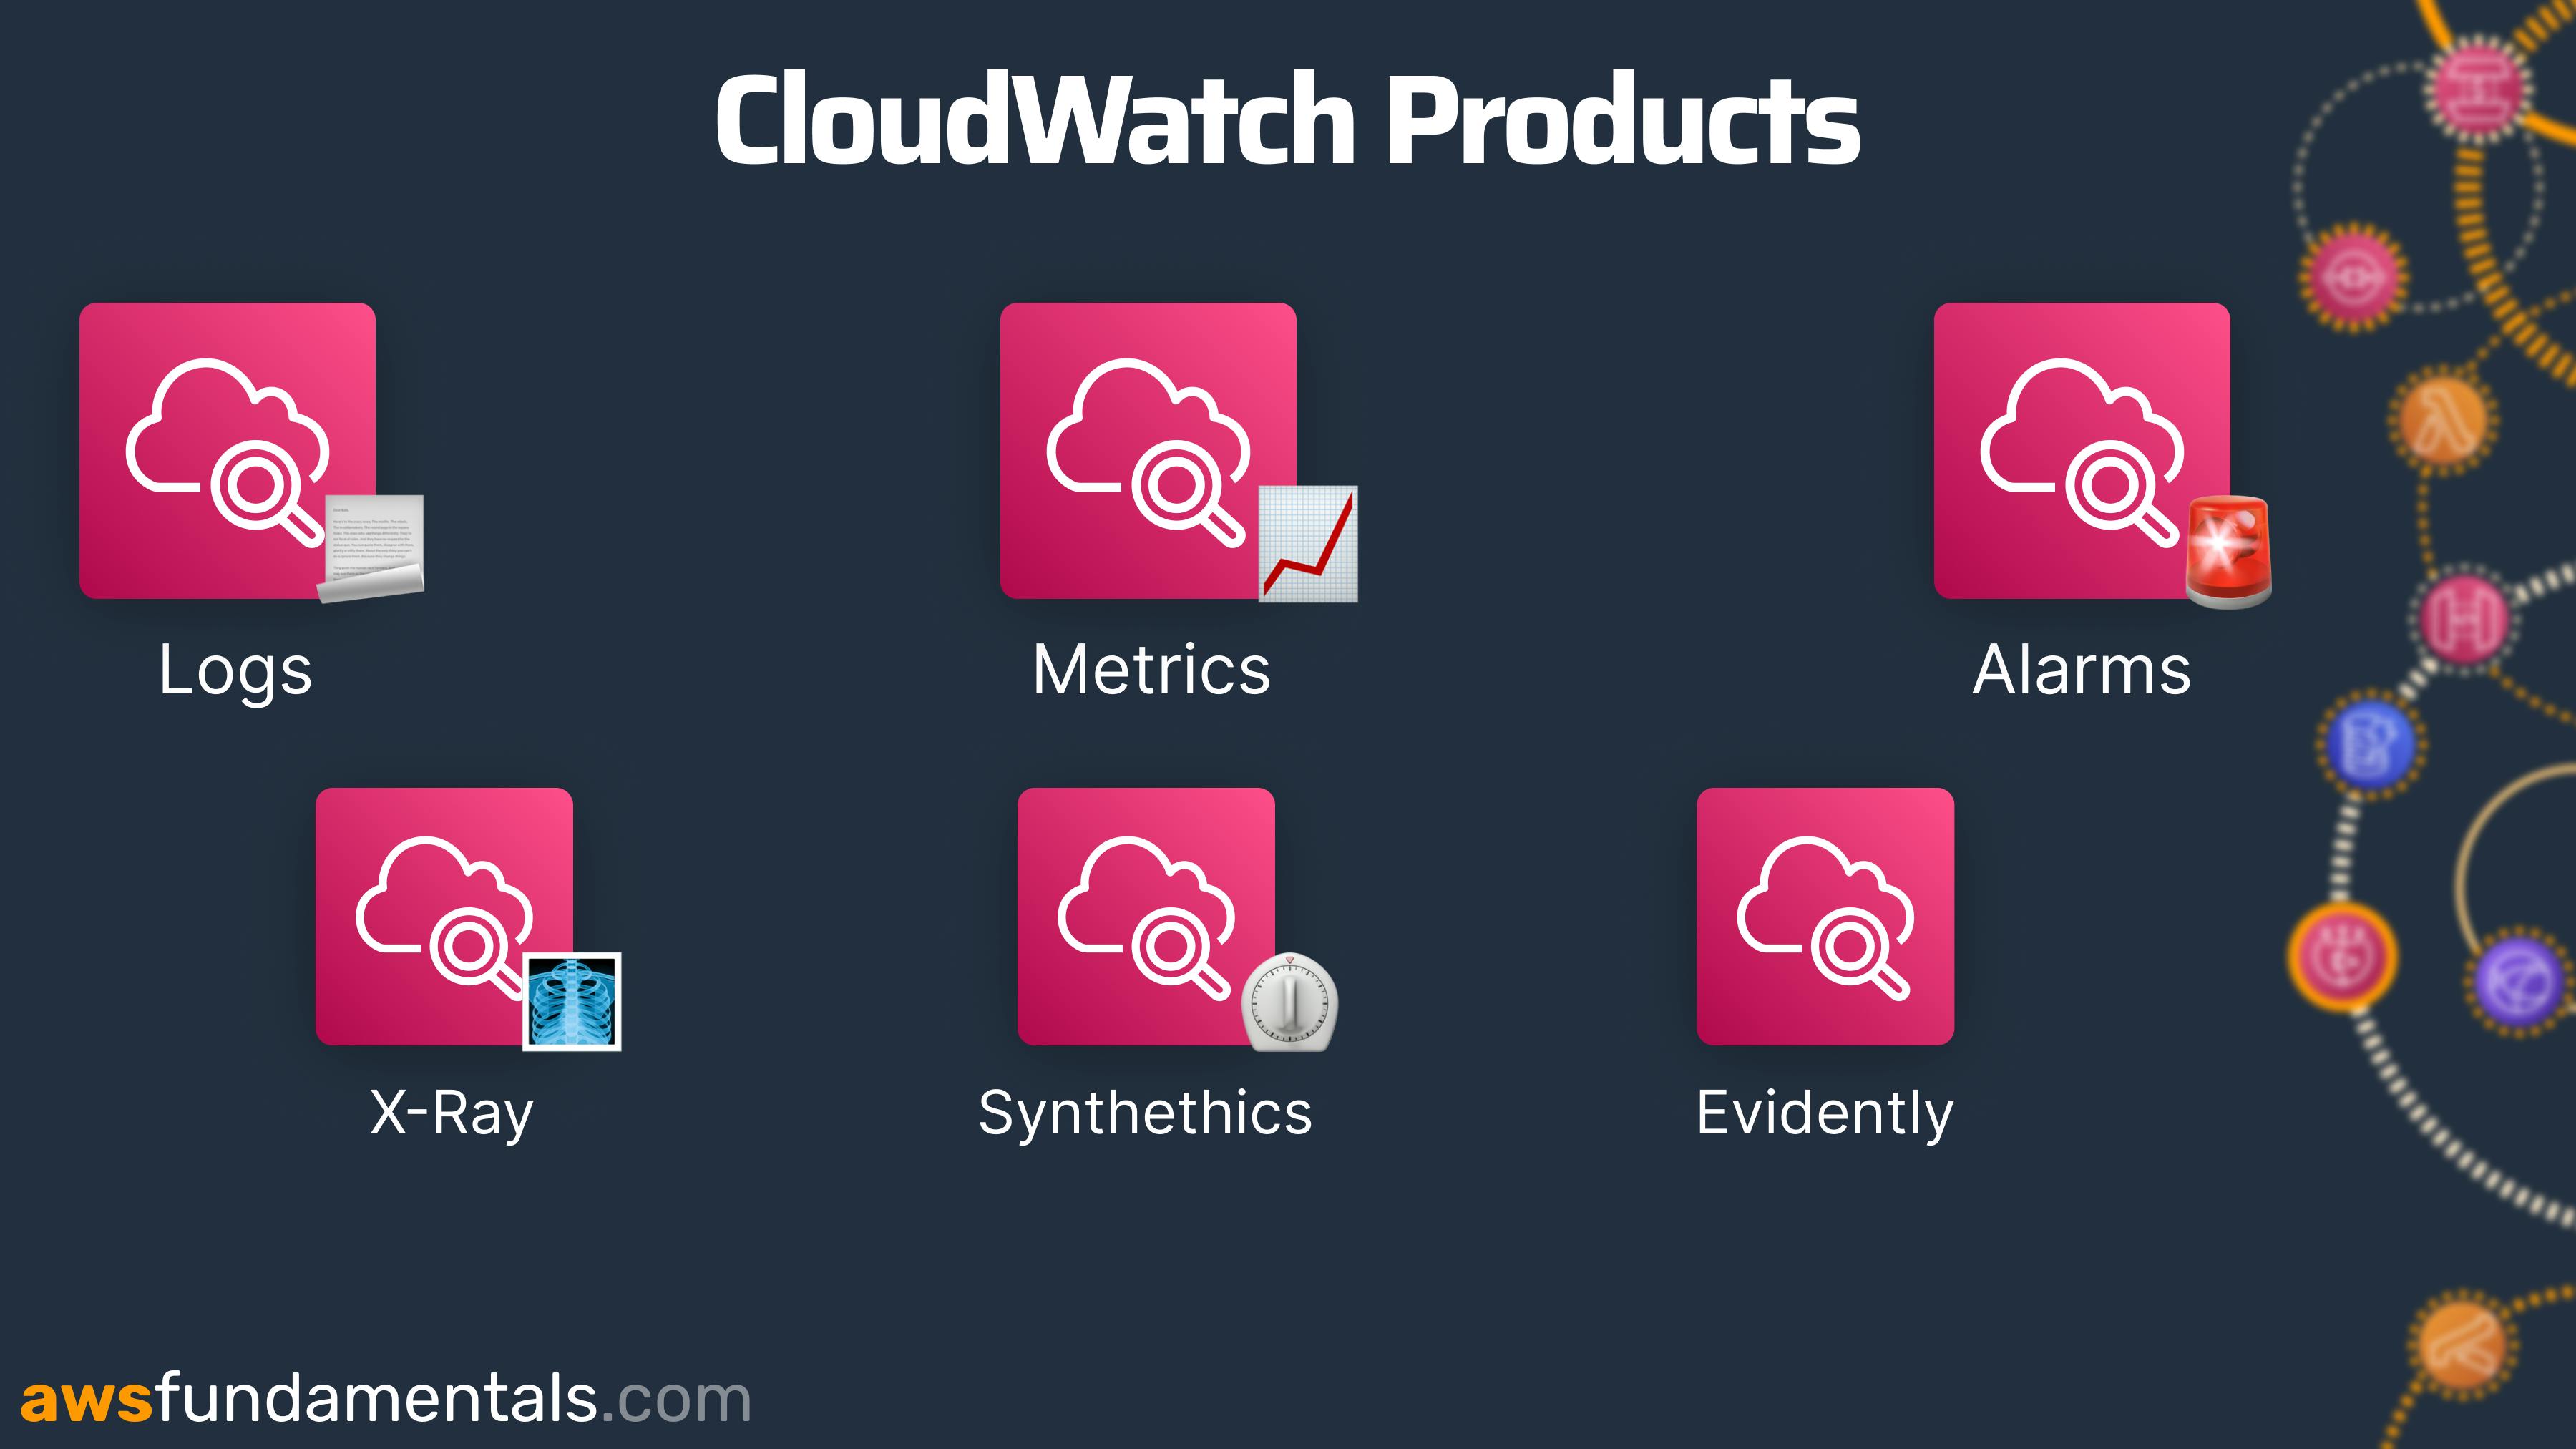
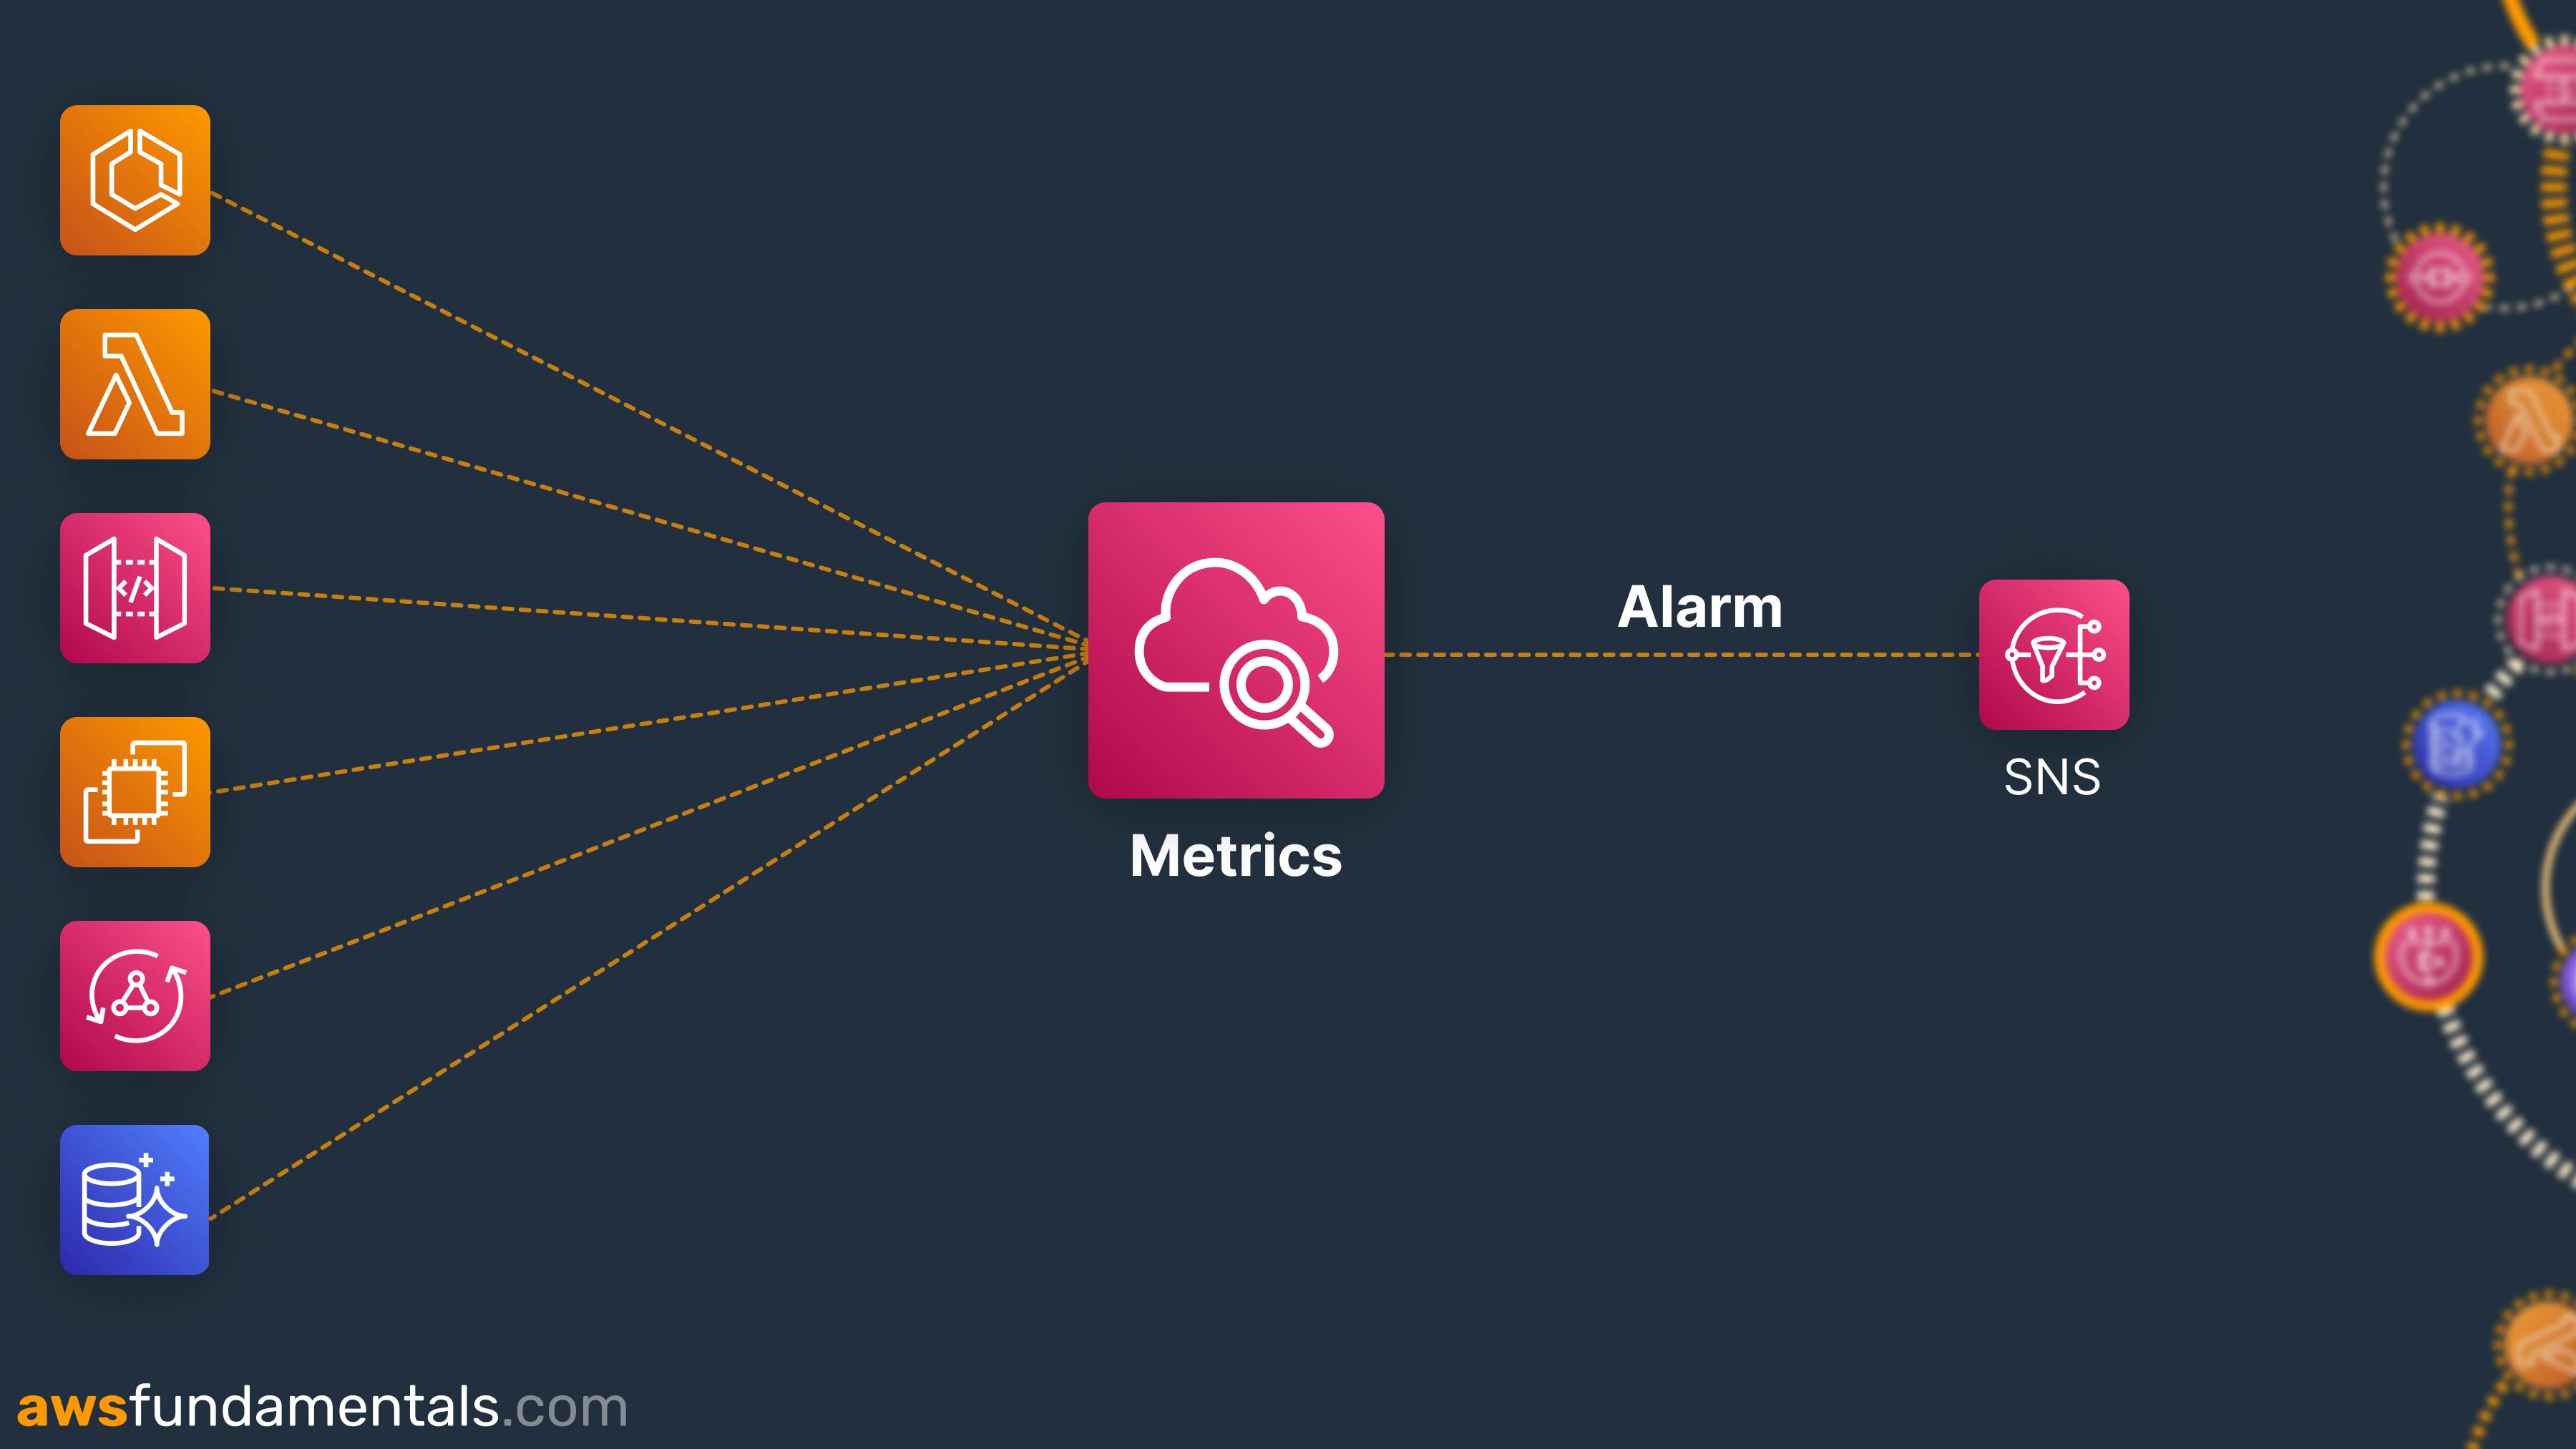
CloudWatch is the monitoring service of AWS. It consists of several products including:
Logs - All native AWS services log directly to CloudWatch
Metrics - You get several system metrics in CloudWatch
Dashboards - Dashboards can give you a quick overview of your application's health
... and many more!
CloudWatch can also notify you if your application is behaving differently than you expected. The goal for you as a developer or DevOps engineer should always be that you be notified about errors in your system before your customers experience them.
This is where CloudWatch Alarms can help you a lot!
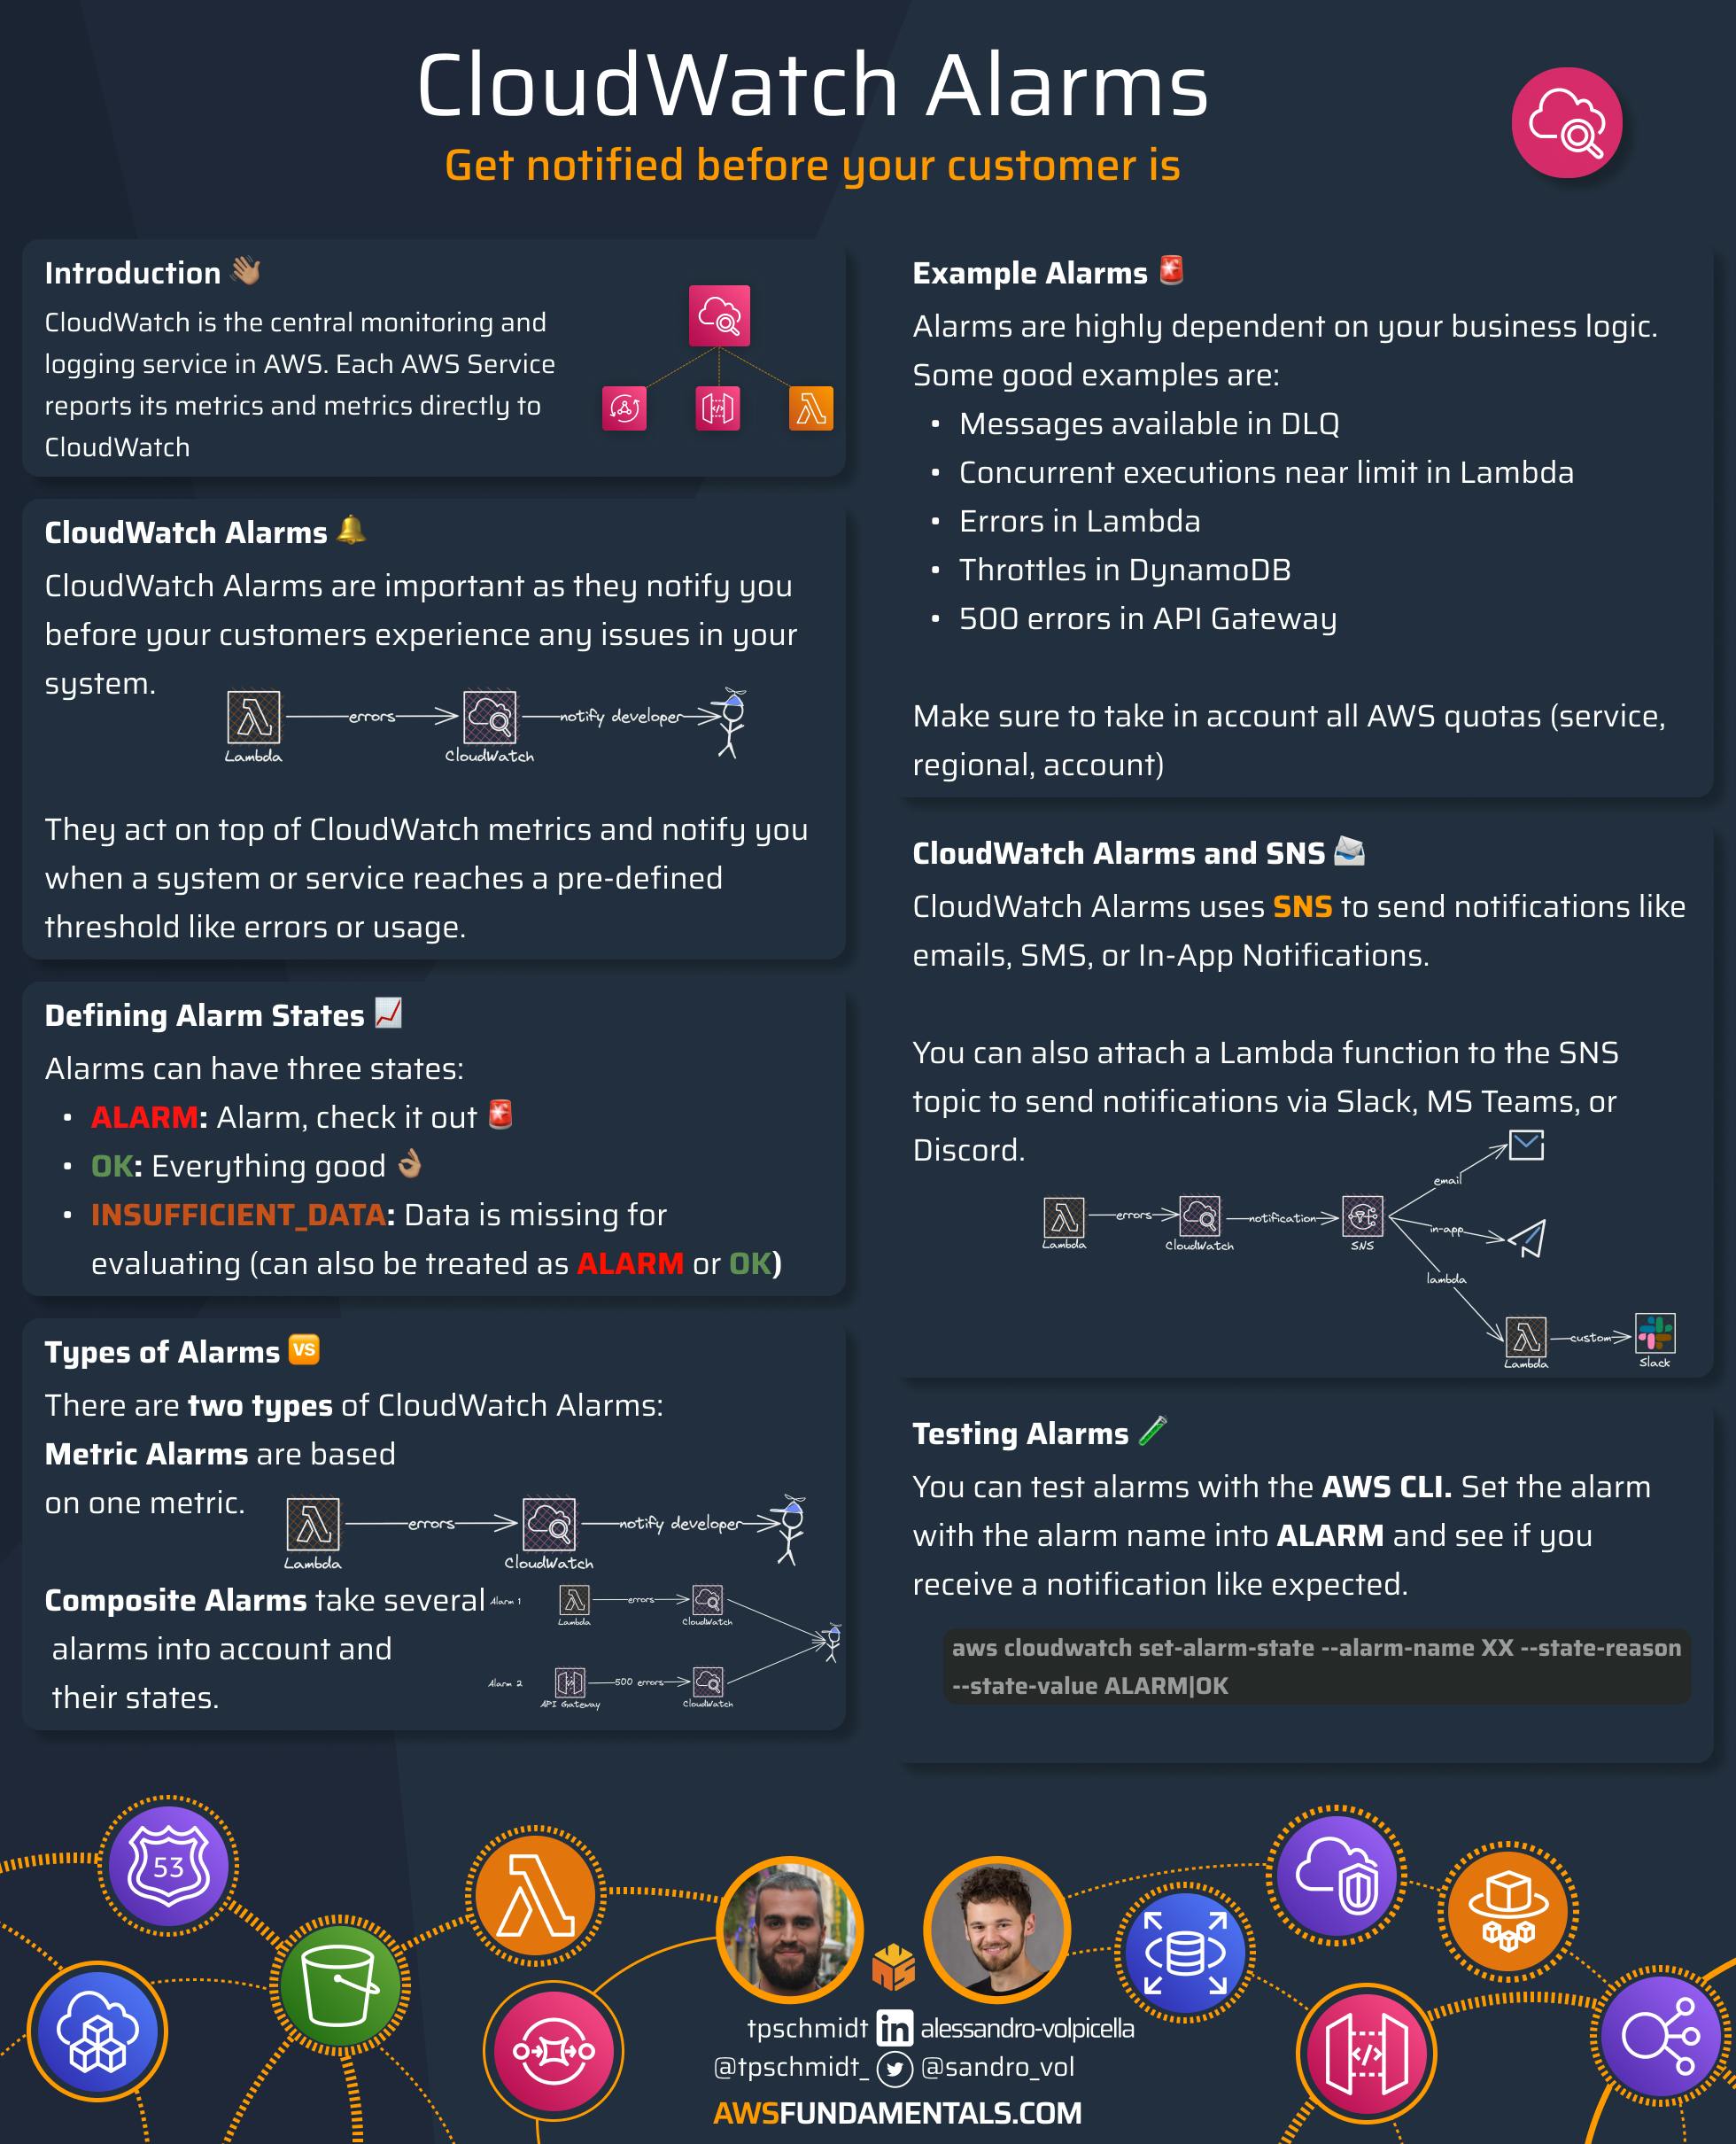
CloudWatch Alarms
CloudWatch Alarms notify you once a system or service reaches a pre-defined threshold like errors or usage. CloudWatch Alarms act on top of CloudWatch metrics.

It is important to spend time defining your alarm thresholds. By having the correct ones you will know when something bad happens. Even before your customer knows. Some good example alarms are:
Messages available in Dead Letter Queues
Number of errors in Lambda functions
Number of 500 errors in API Gateway
Alarm State
Alarms have two main states:
IN_ALARM: The alarm is active -> You need to actOK: The alarm is not active -> All GoodINSUFFICIENT_DATA: Not enough data is available
It is also possible that the alarm doesn’t have sufficient data. You can define if this will trigger the alarm or not. Normally it won’t trigger an alarm.
Alarms Are Dependent on Your Business Logic
Crafting alarms requires skill and depends heavily on your business logic. However, adhering to certain best practices is crucial. One vital aspect to consider is the limits of your AWS Account, which offers varying levels of services, including:
Service limits - Limits of your service, e.g. your Lambda function
Regional limits - Limits of your region, e.g. in
eu-central-1Account limits - Account-wide limits, e.g. the number of concurrent executions on your whole Account
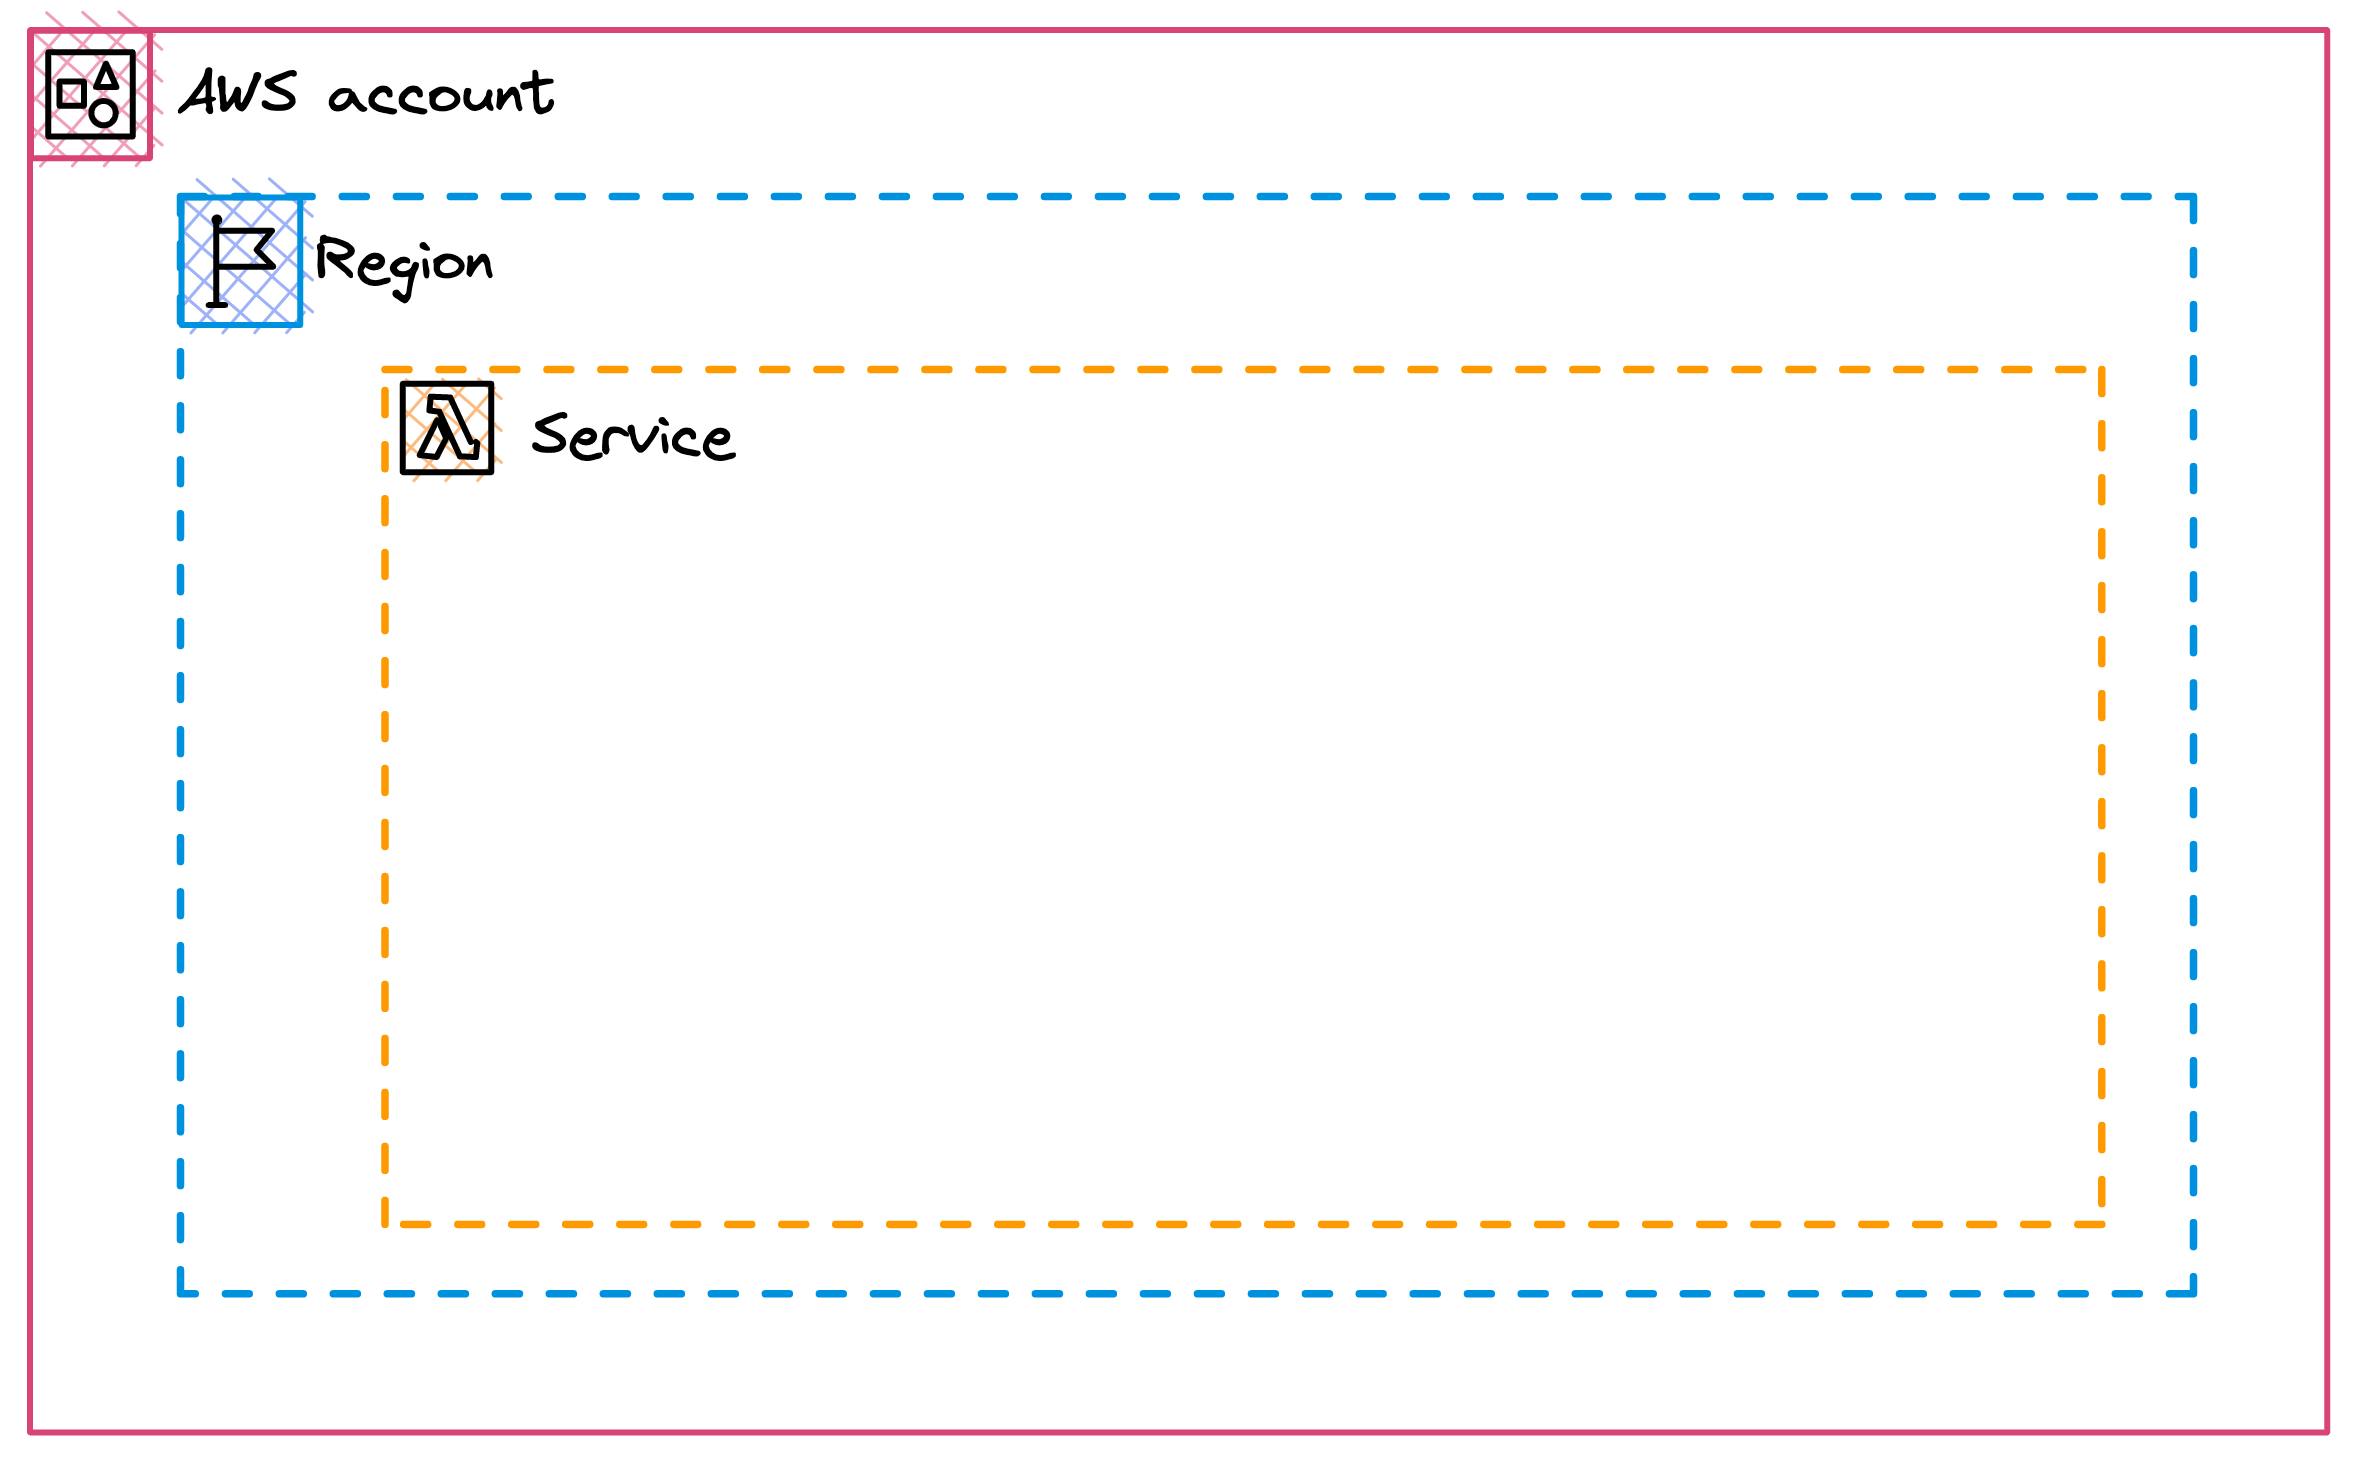
For example, RDS can only have 40 instances per region. Lambda can only have 1,000 Lambdas running at the same time per region. To not run into any issues you need to keep this in mind when setting up your alarms.
Make sure to also create alarms around your given limits by AWS. If you should hit certain limits you will also experience downtime.
Metric Alarms vs. Composite Alarms
There are two different types of alarms:
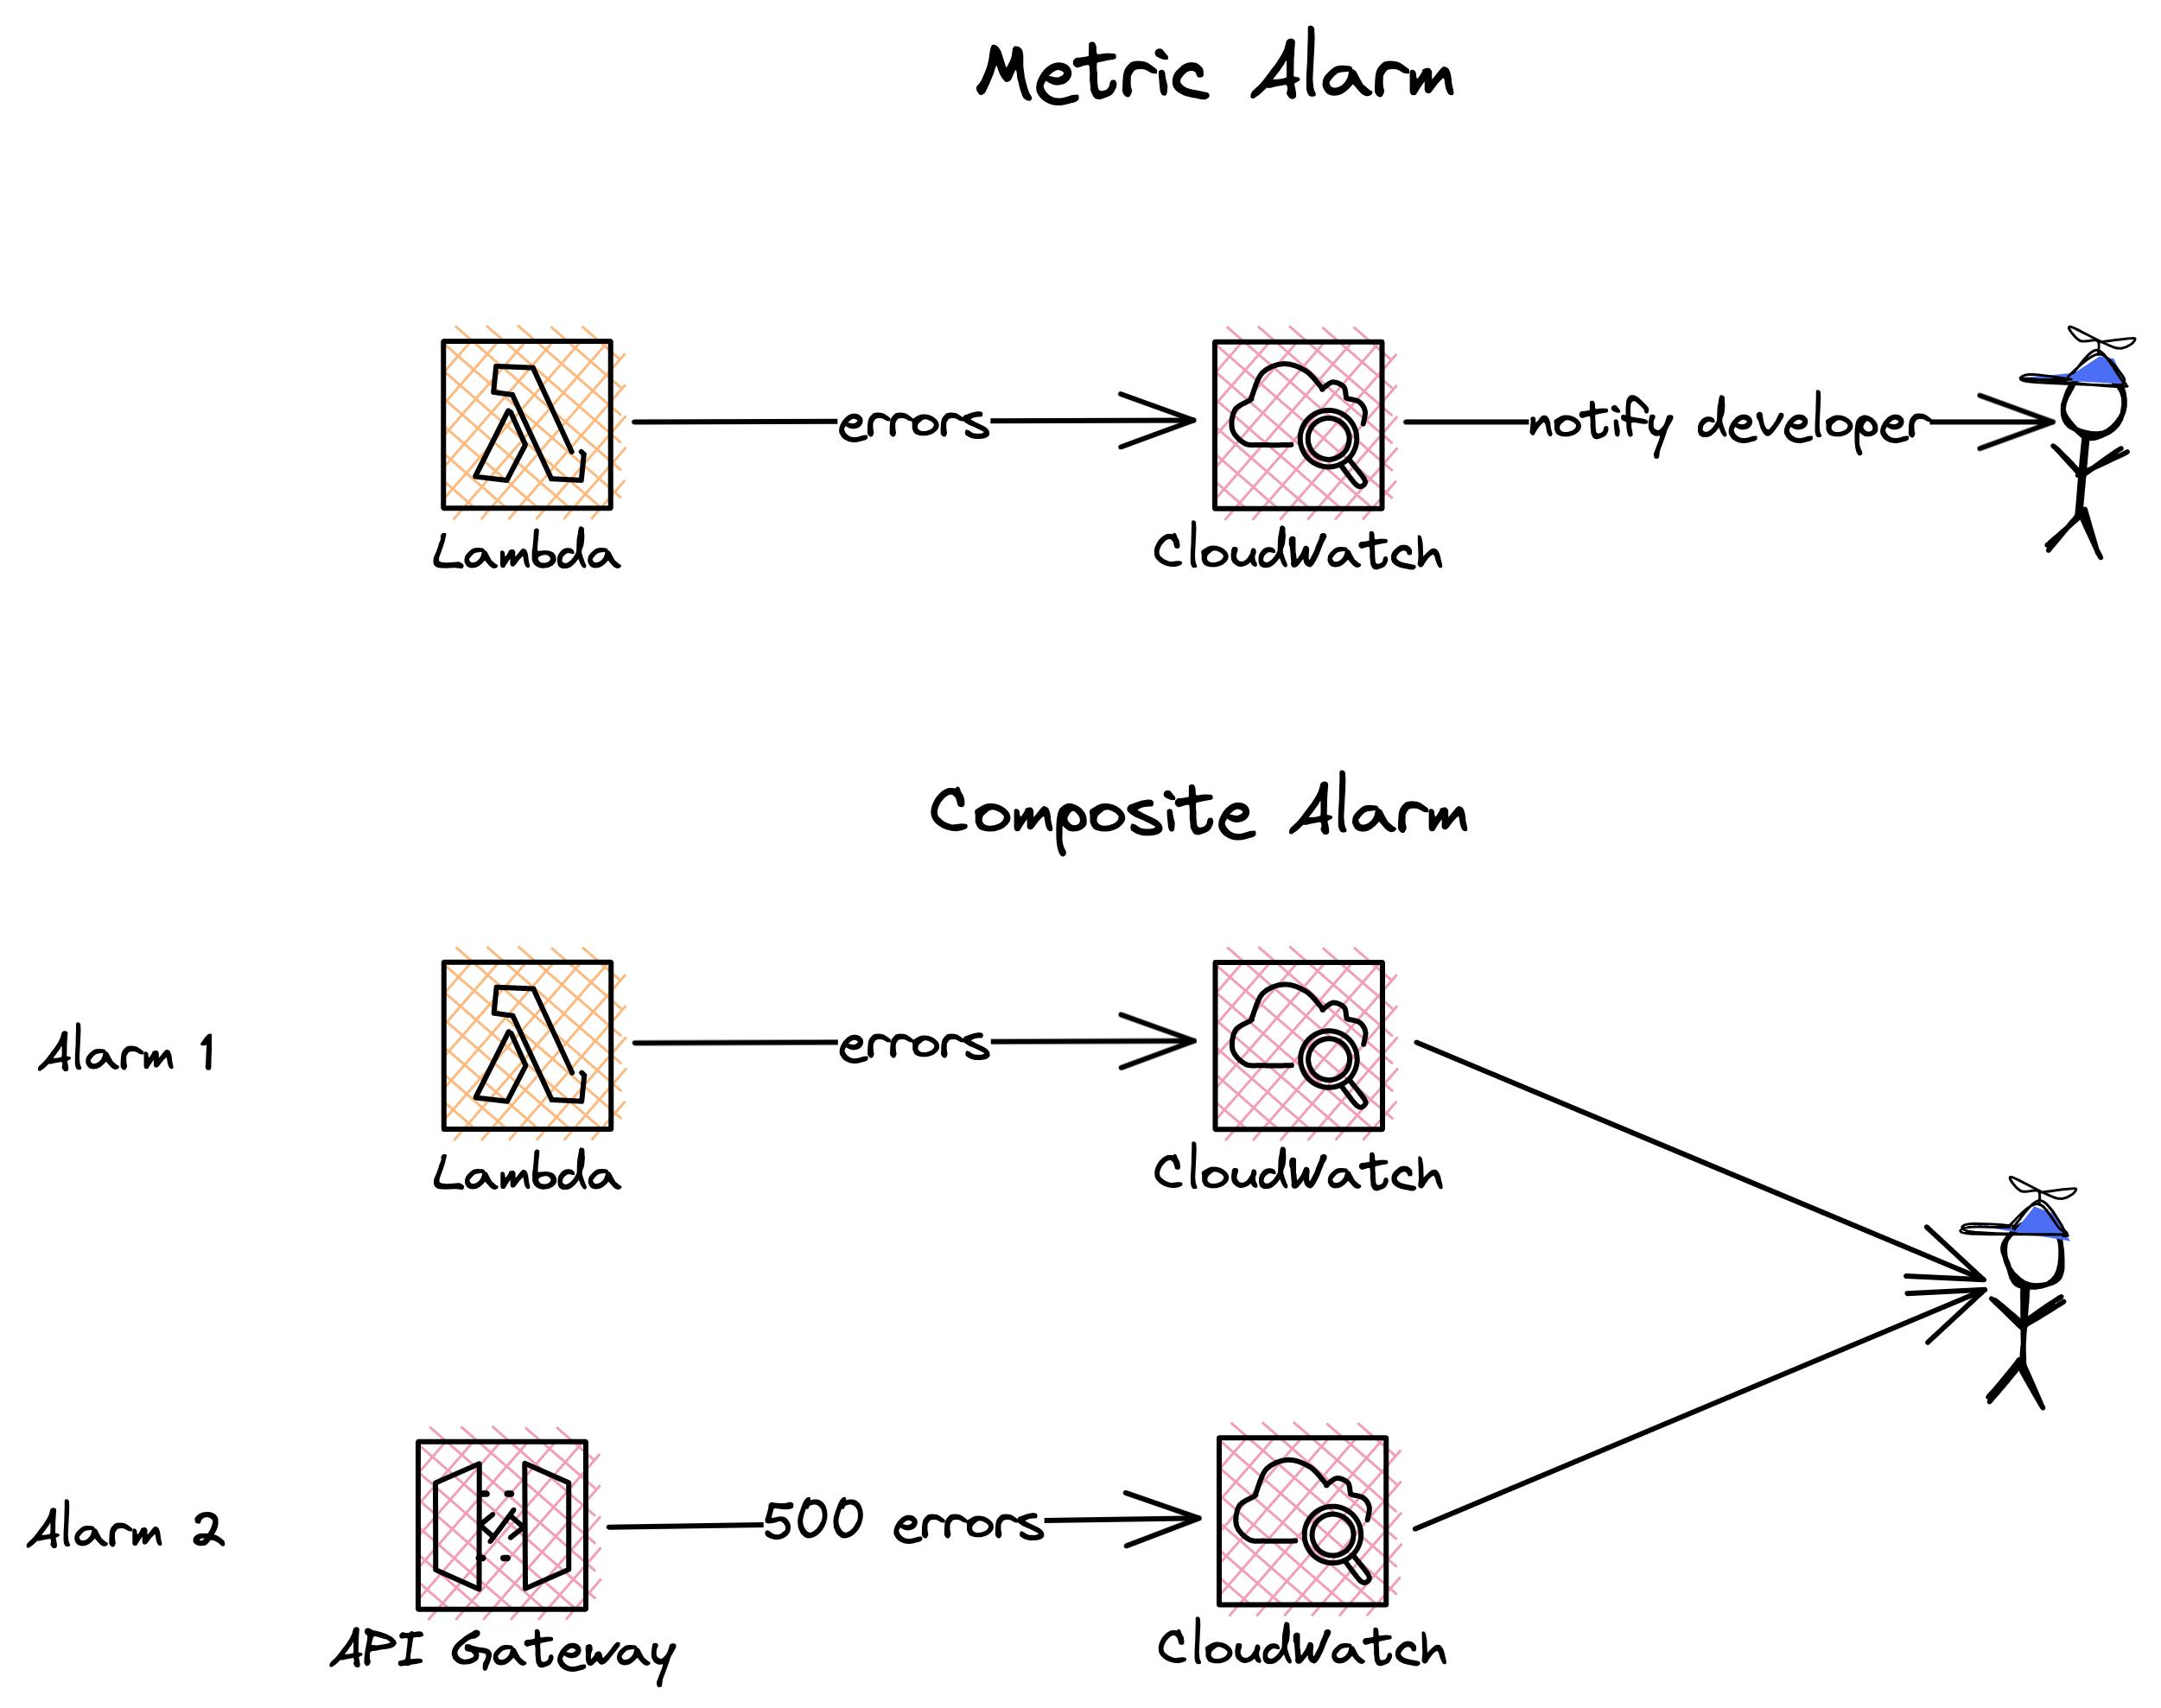
| Typ | Description |
| Metric Alarm | This is an alarm based on one metric. For example, the single number of errors in your Lambda function. |
| Composite Alarm | This alarm takes several alarms into account and their states. For example, you can build an alarm that will only be triggered if two of the three metric alarms are in the state IN_ALARM. For example, one alarm for errors in your Lambda function and another one for 500 errors in your API Gateway. |
CloudWatch Alarms and SNS
CloudWatch Alarms use the Simple Notification Service (SNS) under the hood. SNS is a notification service that can inform you in case of any errors.
It allows you to send personalized emails, SMS, or In-App Notifications in case of alarms. CloudWatch uses SNS to inform you of alarm changes. CloudWatch has really good integration with the E-Mail component of SNS. You can add your email address and get notified of alarms.
Since SNS is really flexible, you can also attach a Lambda function to the SNS topic. The Lambda function can do multiple things to alarm you. Some standard use cases are sending notifications via Slack, MS Teams, or Discord. You can also use PagerDuty to get informed about changes.
Now, let's see a CloudWatch Alert in action! 🚨
Setting Up CloudWatch Alarms
There are different ways for setting up Alarms. In this post, we will set up an alarm via the AWS Web Console.
Creating an alarm
Head over to CloudWatch -> Alarms -> All Alarms. Click on Create Alarm.
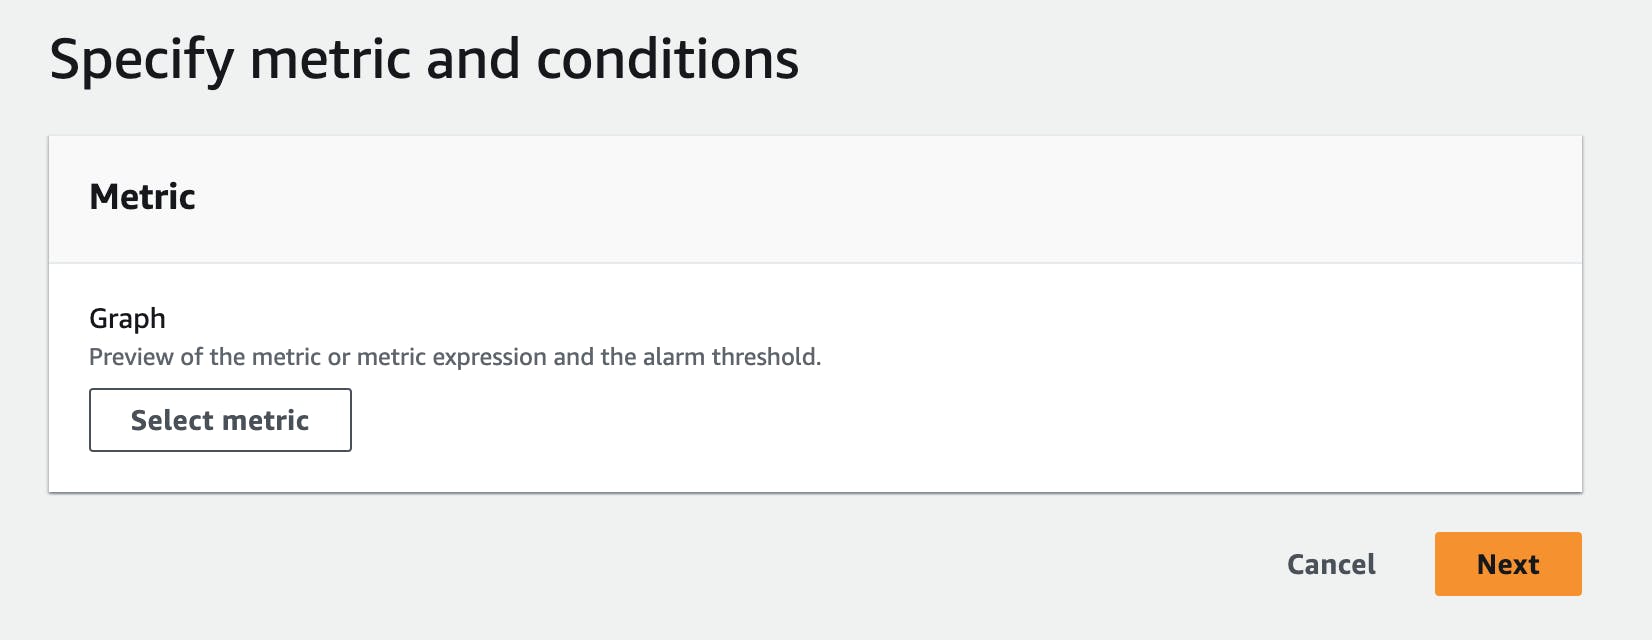
You now have to select a metric.
Defining alarm conditions
I chose the metric:
Namespace - AWS/Lambda
Metric name - Errors
Dimension - Across all functions
This will give me all errors across all Lambda functions.
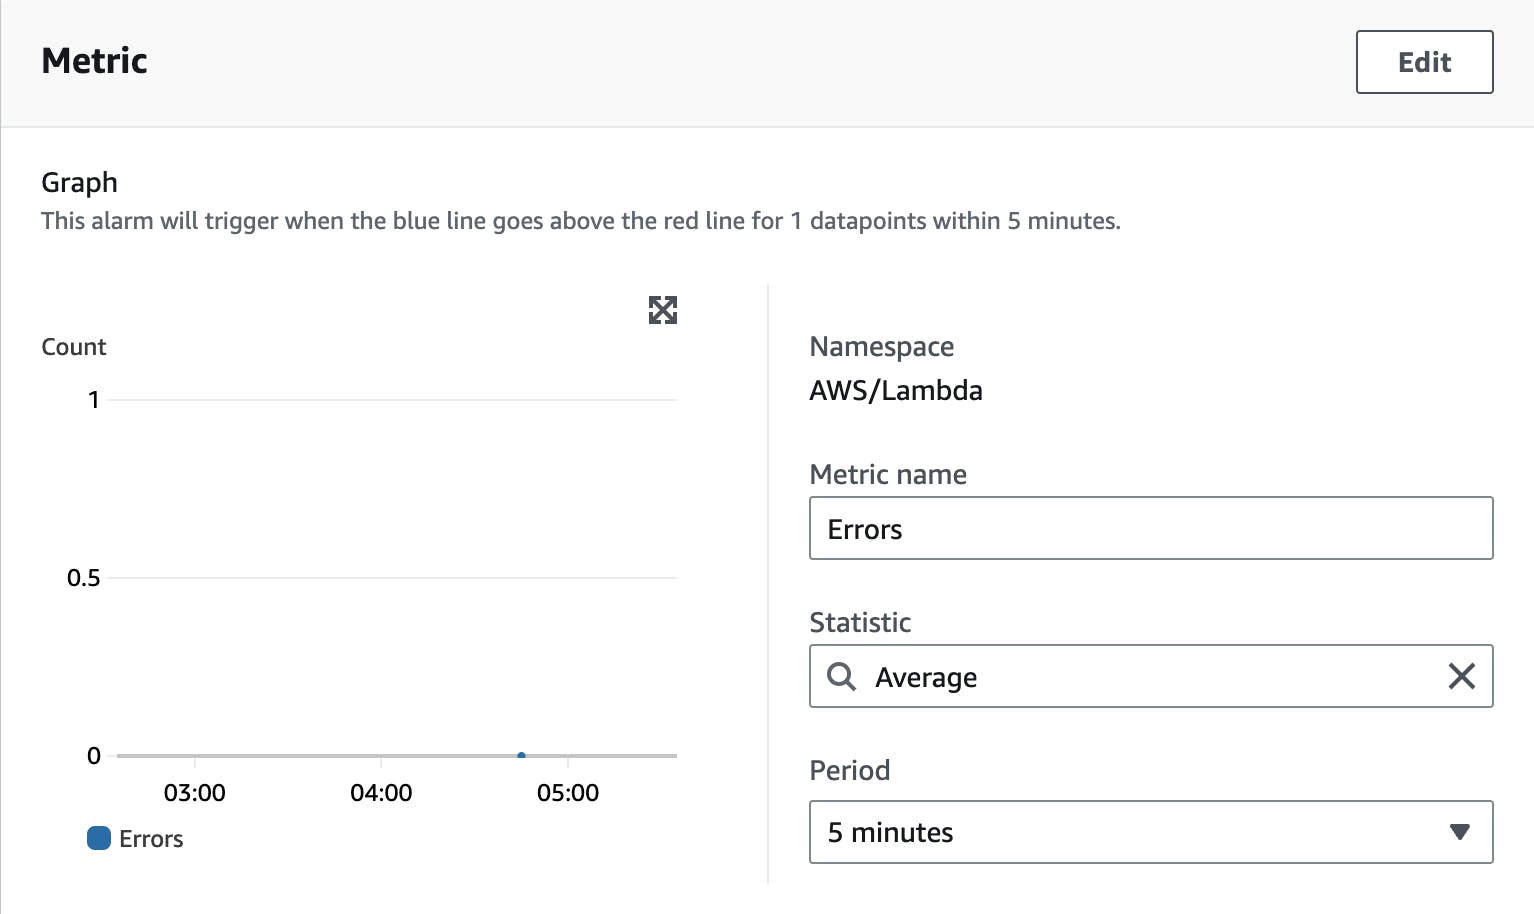
Now you need to define a Statistic function and a period. The statistic function defines how your metric points are calculated to reach an error. The period defines the period it uses to calculate this error.
For example, with Average and a period of 5 minutes, you define that if your Lambda functions have an average number of errors (we define the number in the next step) within 5 minutes the alarm will be triggered.
Other Statistic functions can be:
Sum
Minimum
Maximum
Percentiles
Count
... and many more
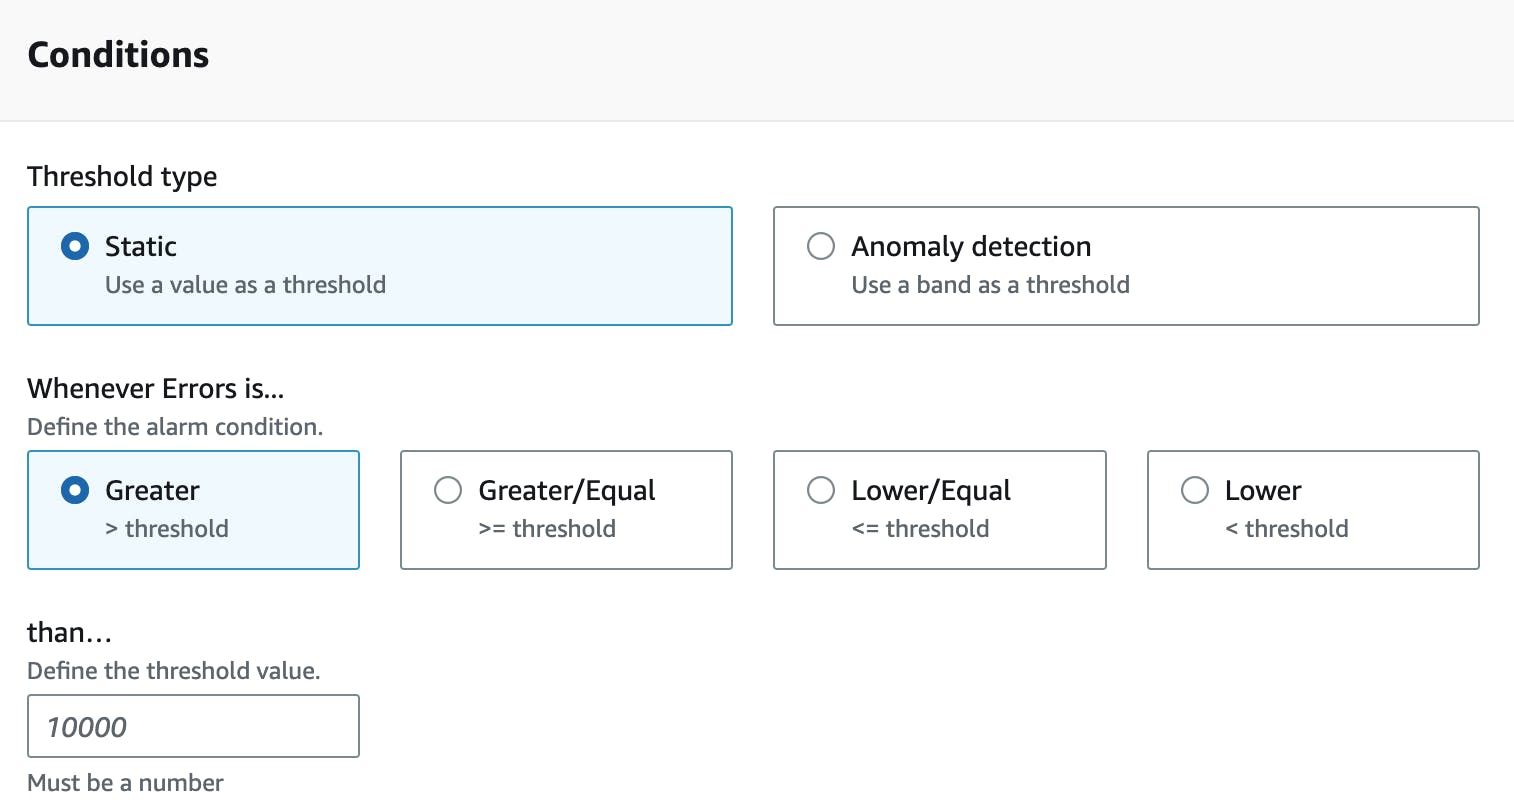
Defining a Threshold
The next step is to establish a threshold for when your alarm should be activated.
Configuring Actions for Alarm Notifications
The next step is to define actions that should happen after an alarm changes it state.
First, you need to define the Alarm state trigger. This defines the state that triggers this alarm. You can choose from:
IN_ALARMOKInsufficient data
Typically, you'll want to be notified once your alarm hits the status IN_ALARM.
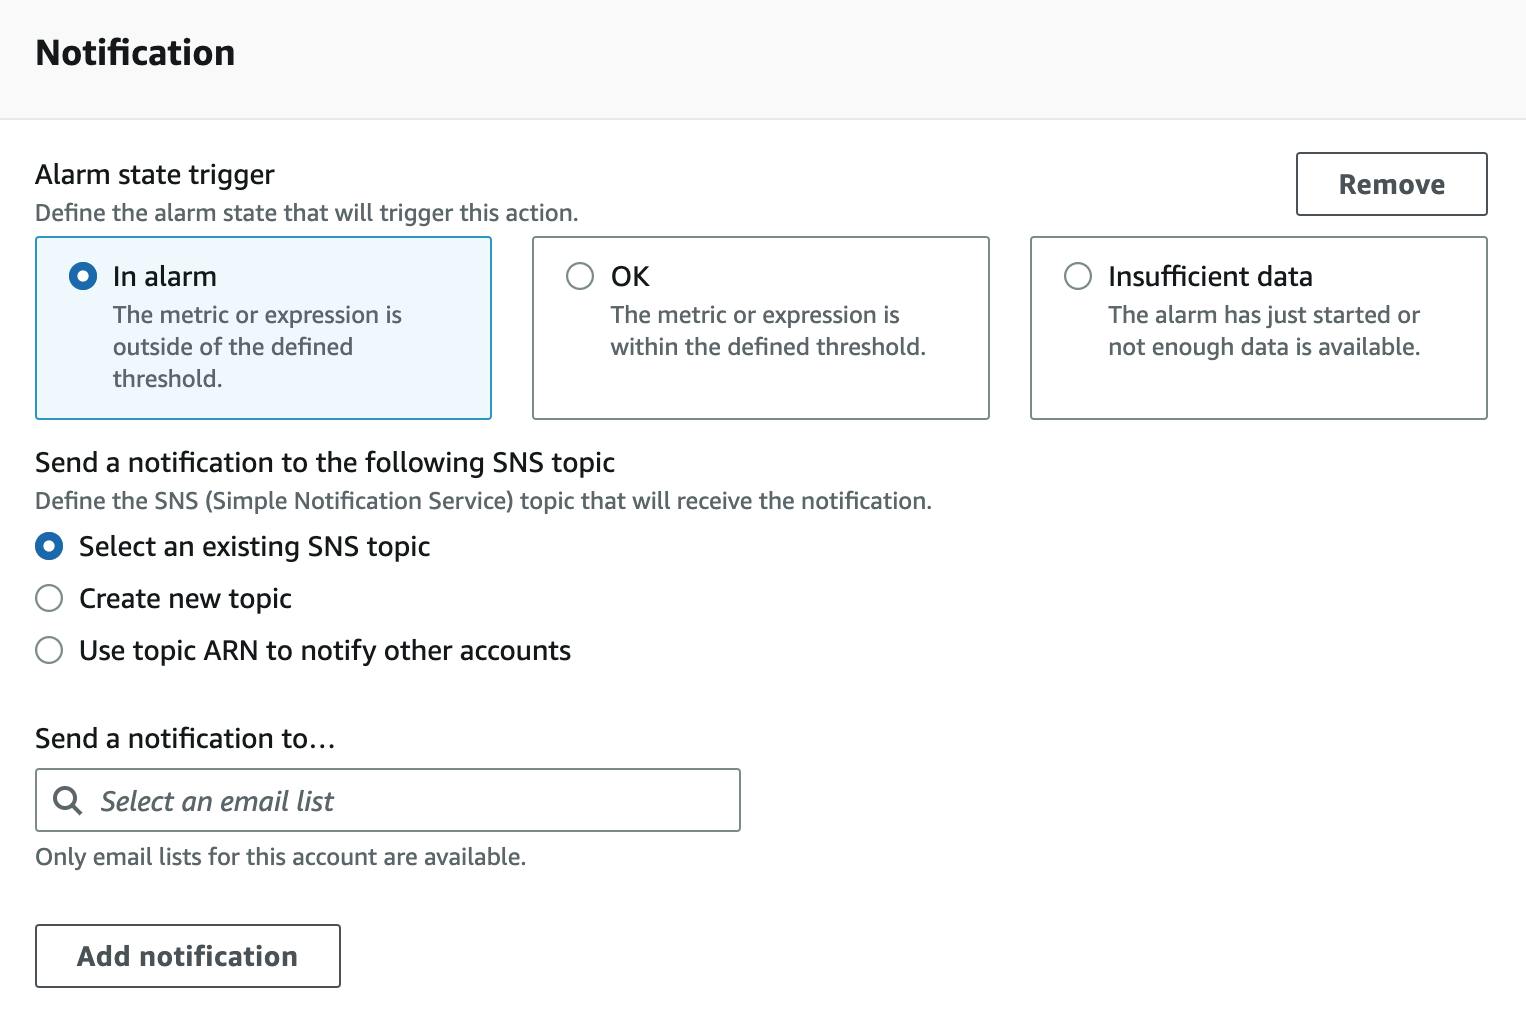
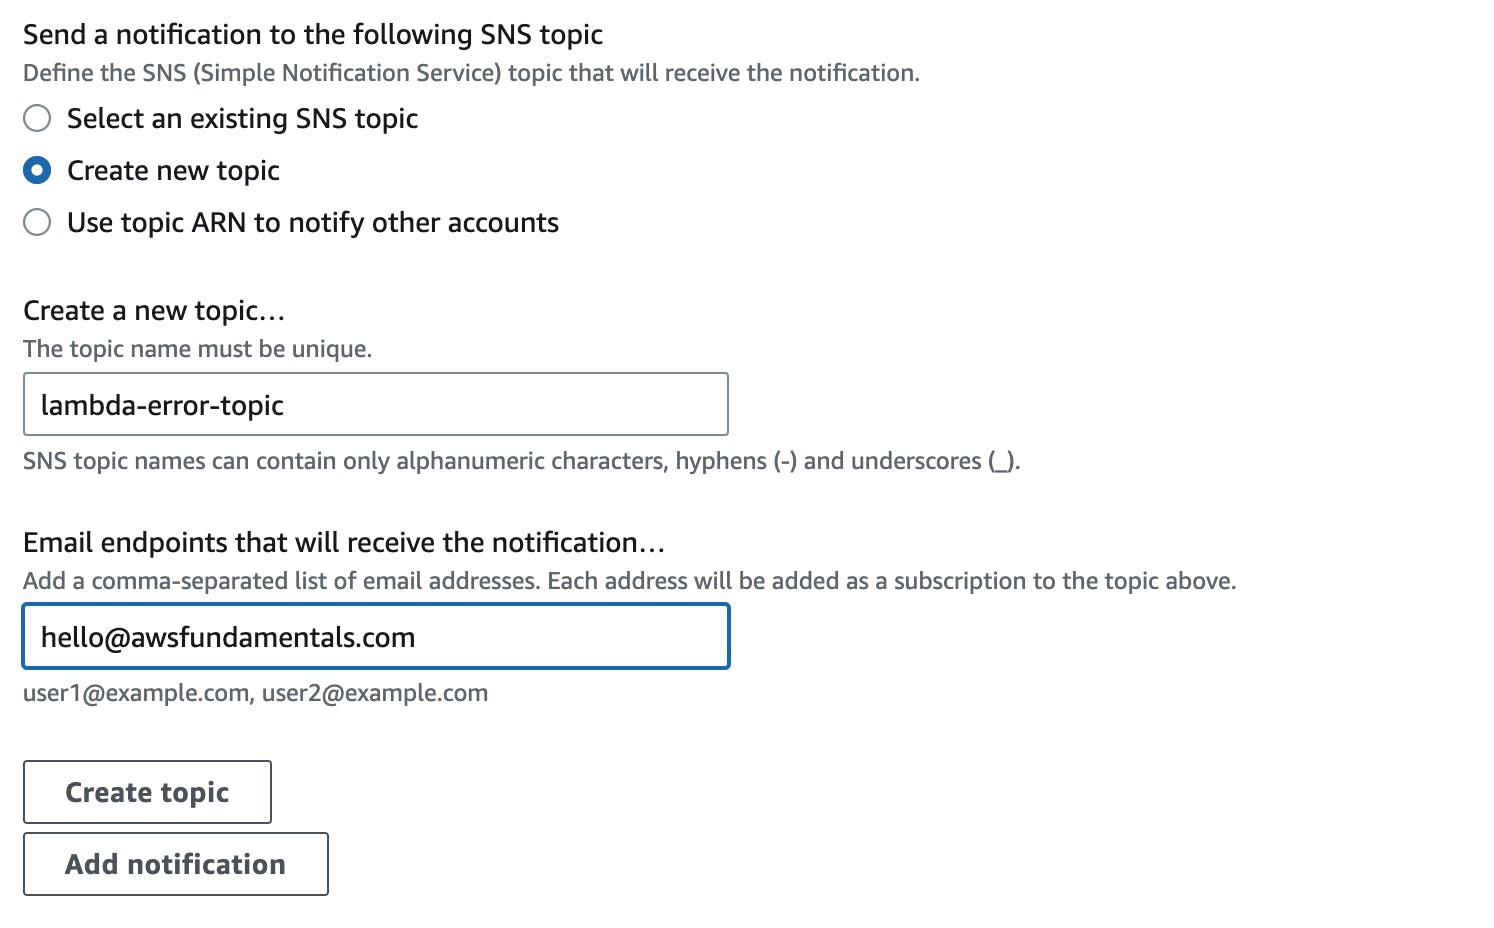
As mentioned above, CloudWatch uses SNS under the hood for sending out notifications, typically emails. You can choose from the above to either use an existing SNS topic (in case you have one already), create a new topic, or even use directly an ARN to use a topic from another account.
For this example, we will create a new SNS topic and send an e-mail directly to our inbox.
There are some other options like Auto Scaling options (yes you can even auto-scale from CloudWatch Alerts) and EC2 actions but we will ignore them for this use-case.
Click on Next to give your alarm a name, click again on next and you will get an overview of your alarm.
Alarm Overview
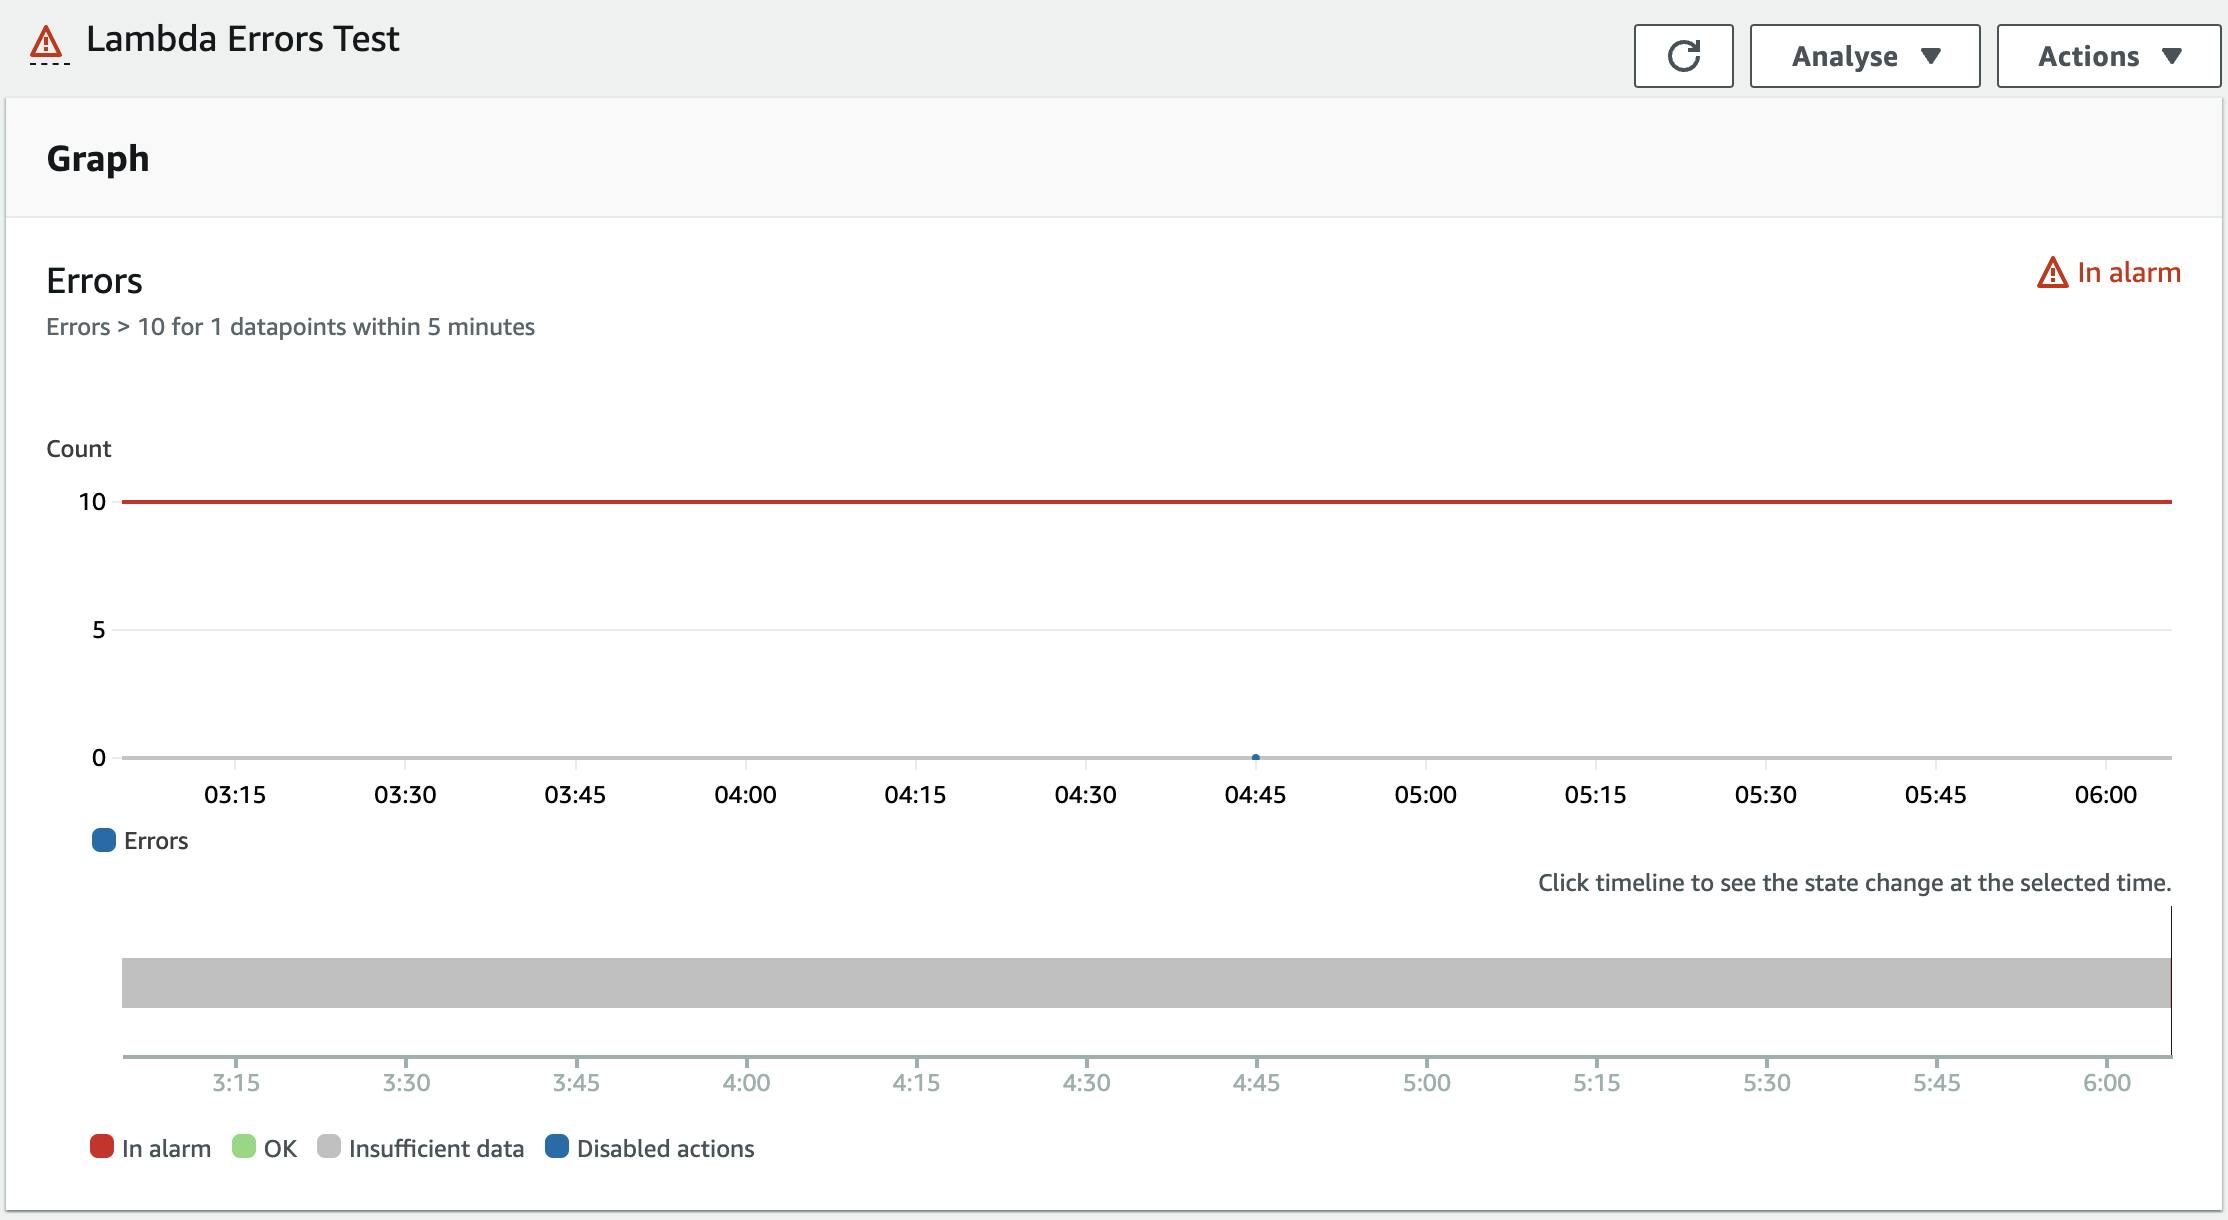
Let's Test the Alarm
To be sure that our alarm actually works we can mock on alarm by using the AWS CLI. Use the following CLI prompt to put your alarm in alarm state:
aws cloudwatch set-alarm-state --alarm-name $ALARM_NAME --state-reason "Testing" --state-value ALARM
After executing it the alarm is in the state ALARM :
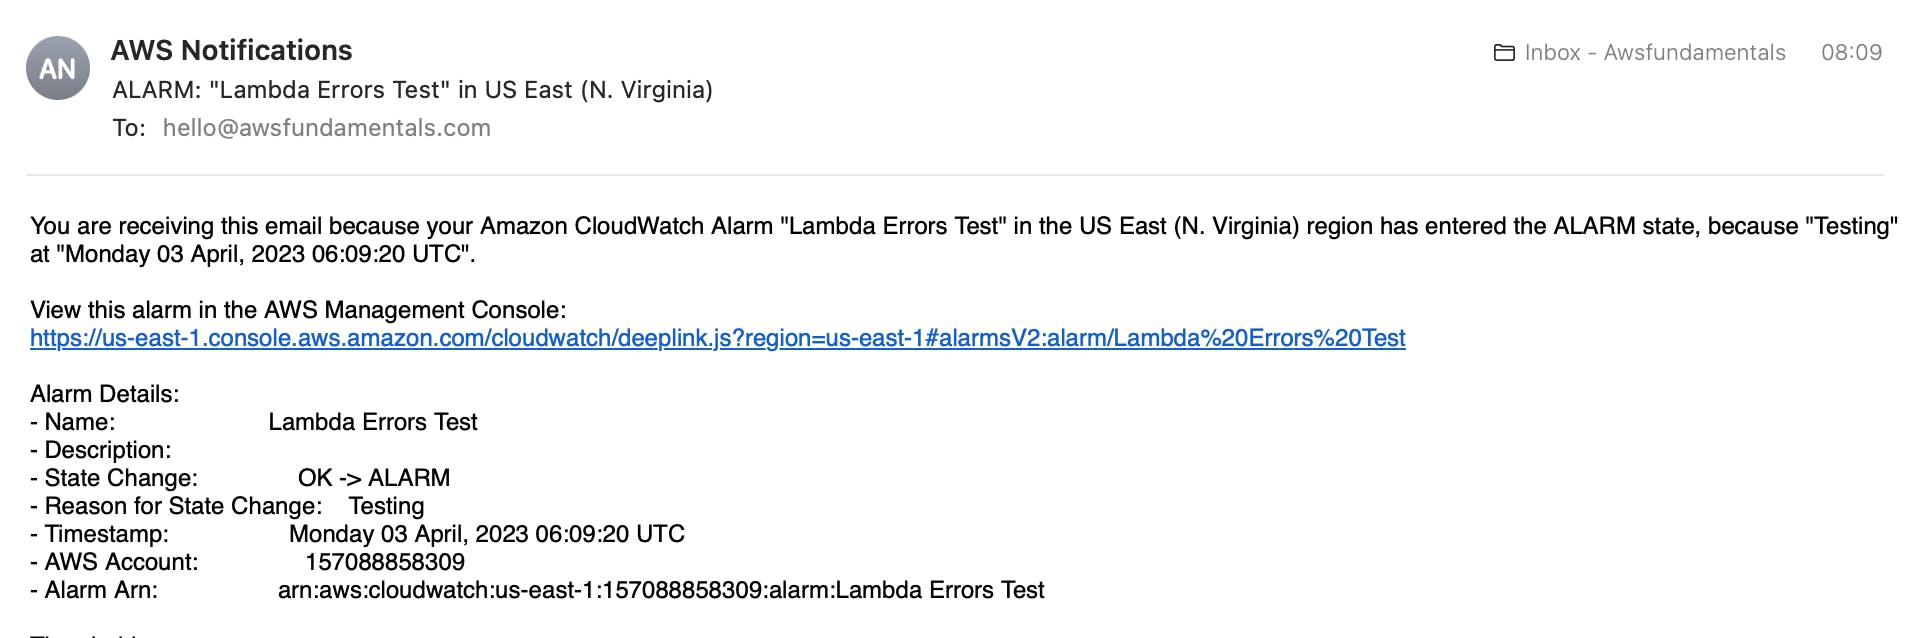
If you check your emails you should see an incoming email with a CloudWatch Alarm notification like that:
Execute the same bash command again just with the state OK to have the alarm in the correct state again.
aws cloudwatch set-alarm-state --alarm-name $ALARM_NAME --state-reason "Testing" --state-value OK
Your alarm works! 🎉
Conclusion
In conclusion, CloudWatch Alarms are an essential tool for monitoring your AWS resources and ensuring that you are notified of any issues before they impact your customers.
By setting up alarms based on your business logic and adhering to best practices such as keeping AWS service limits in mind, you can effectively monitor your system and take action when necessary.
With the help of SNS, CloudWatch Alarms can send personalized notifications to inform you of any changes in your system's state.
By following the steps outlined in this article, you can easily set up CloudWatch Alarms and test them to ensure that they are working as intended.