


TLDR;
Here is a quick overview 😉
Introduction
CloudWatch Overview
Amazon CloudWatch is the application monitoring service within AWS. Almost all AWS services send metrics and logs directly to CloudWatch, making CloudWatch the central monitoring place.
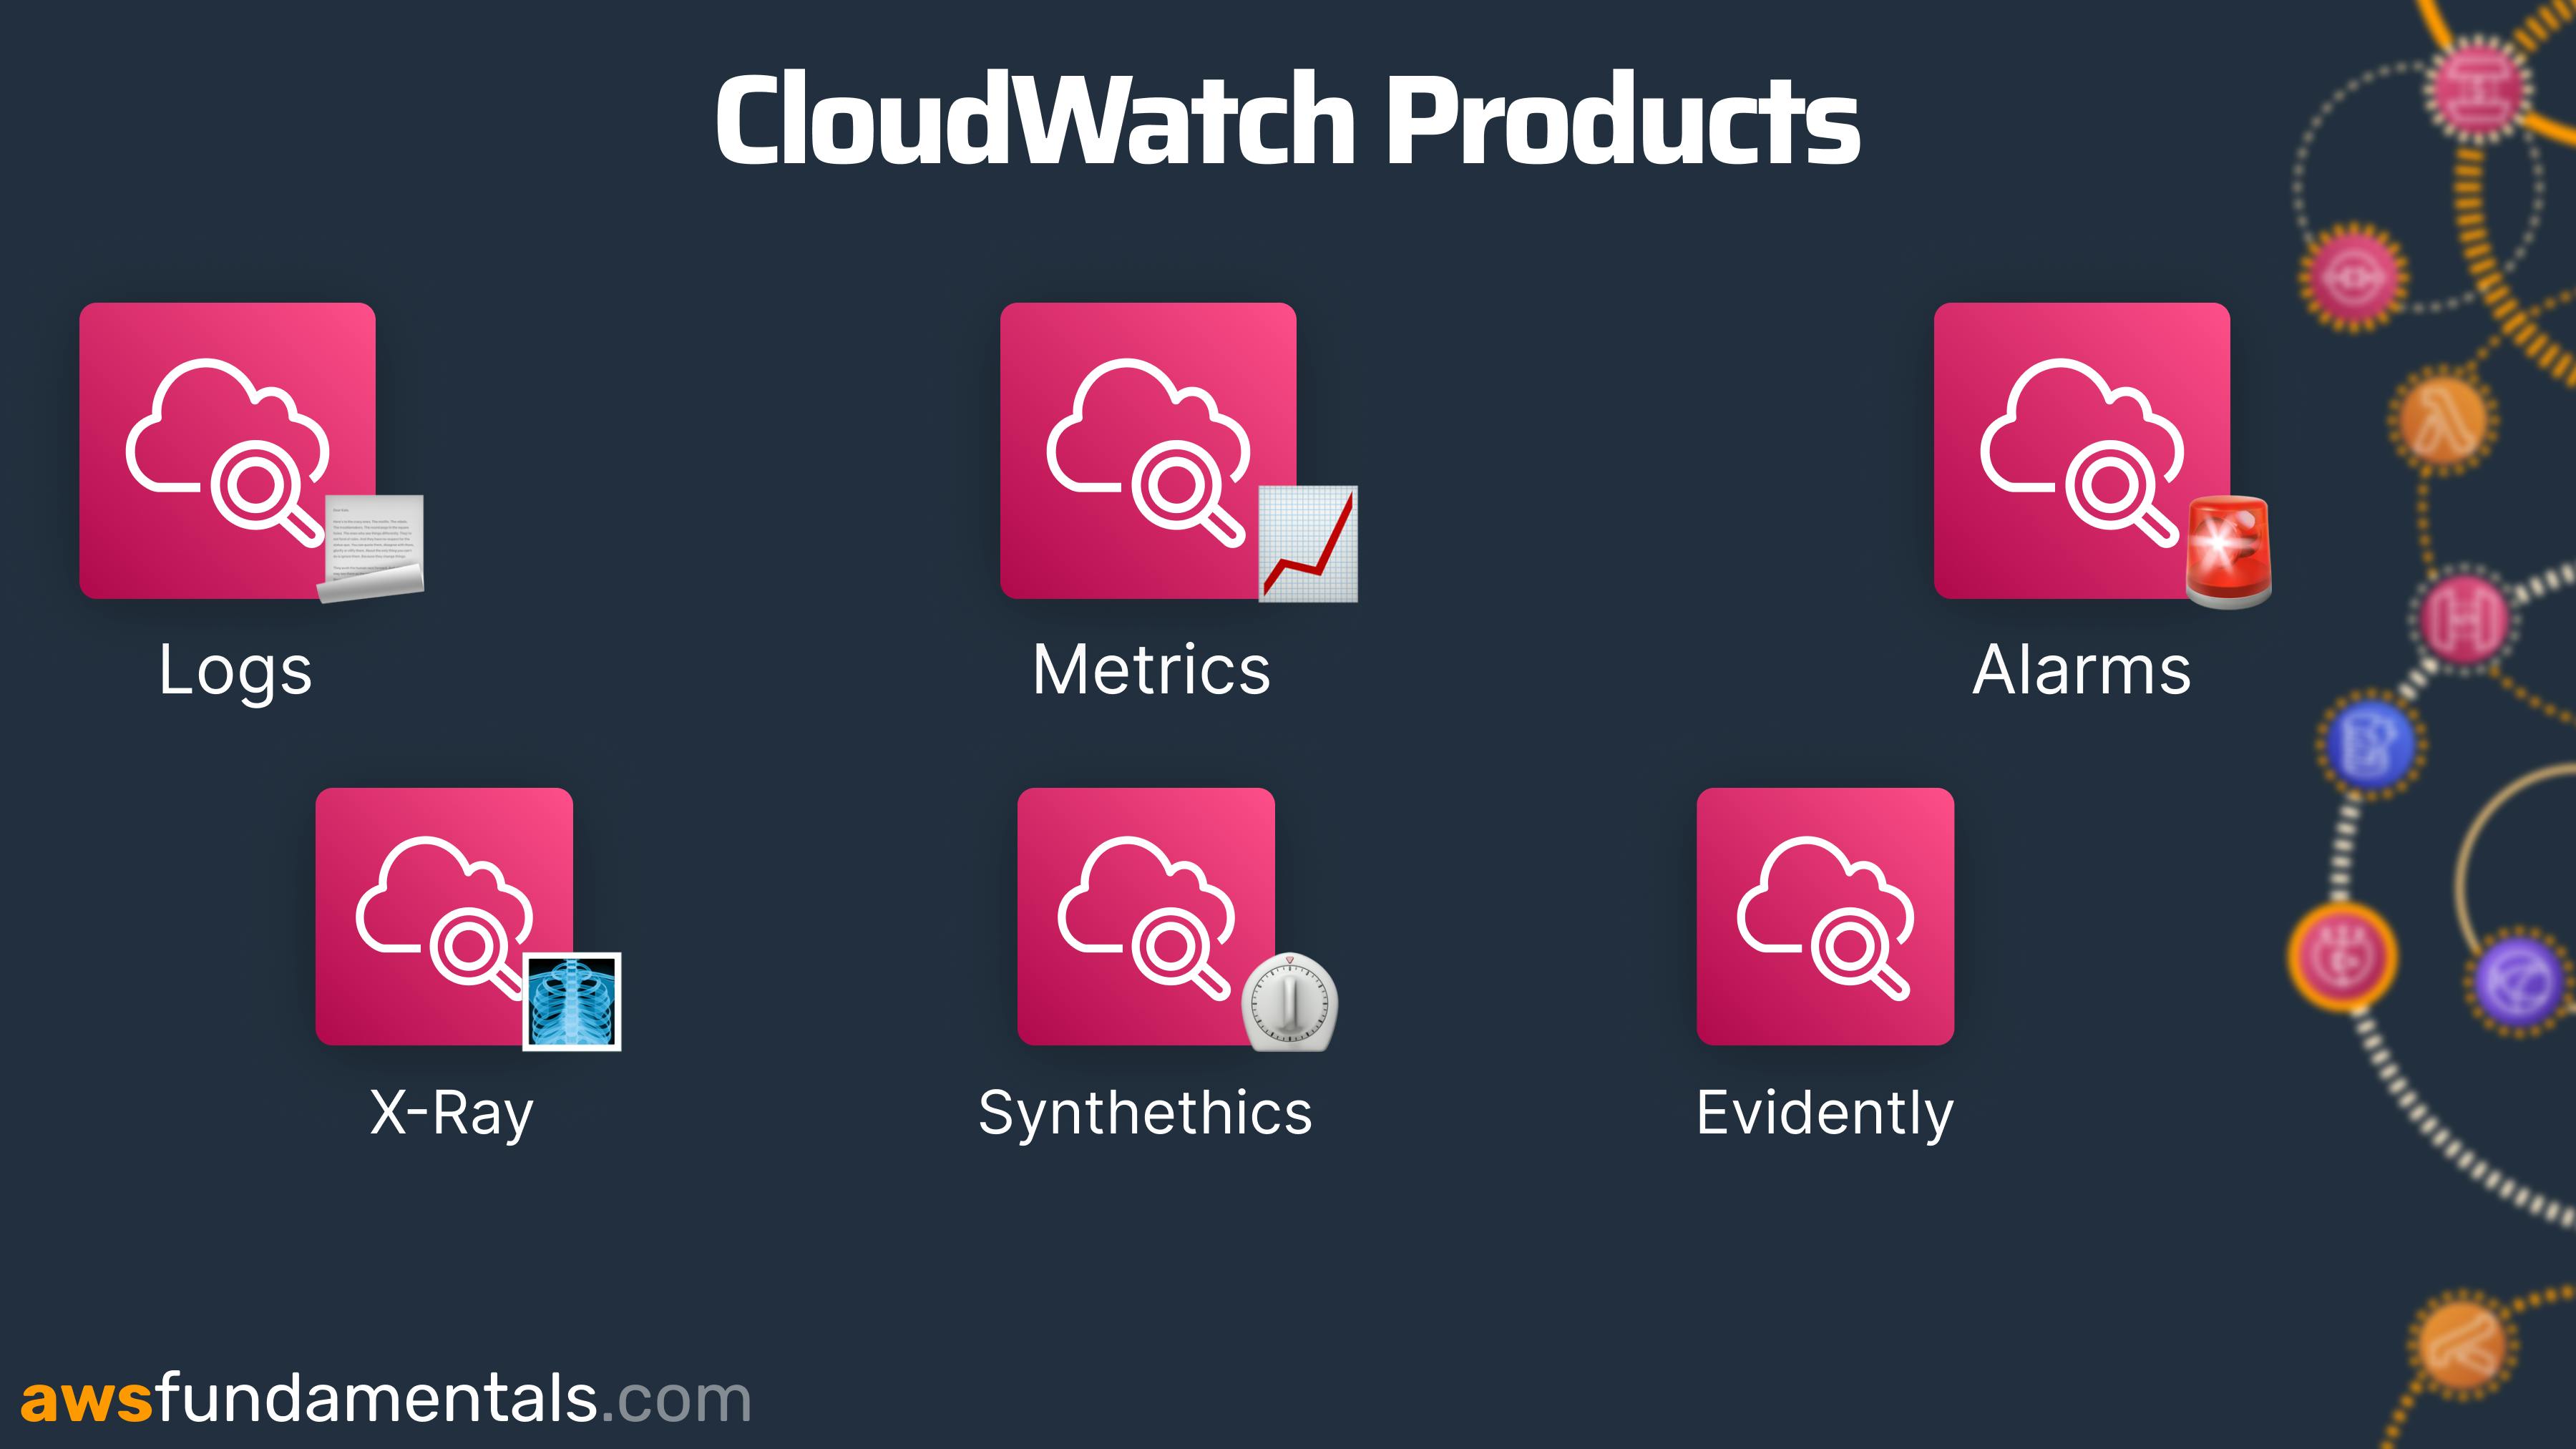
CloudWatch consists of a suite of various products like:
CloudWatch Alarms
CloudWatch Metrics
CloudWatch Synthetics
... and many more!
Introduction to CloudWatch Metrics
CloudWatch acts as a metrics repository for all AWS Services. Each application sends not only logs to CloudWatch but it also sends metrics to this service.

If you take Lambda as an example, we receive the following metrics:
Errors
Invocations
Throttles
Duration
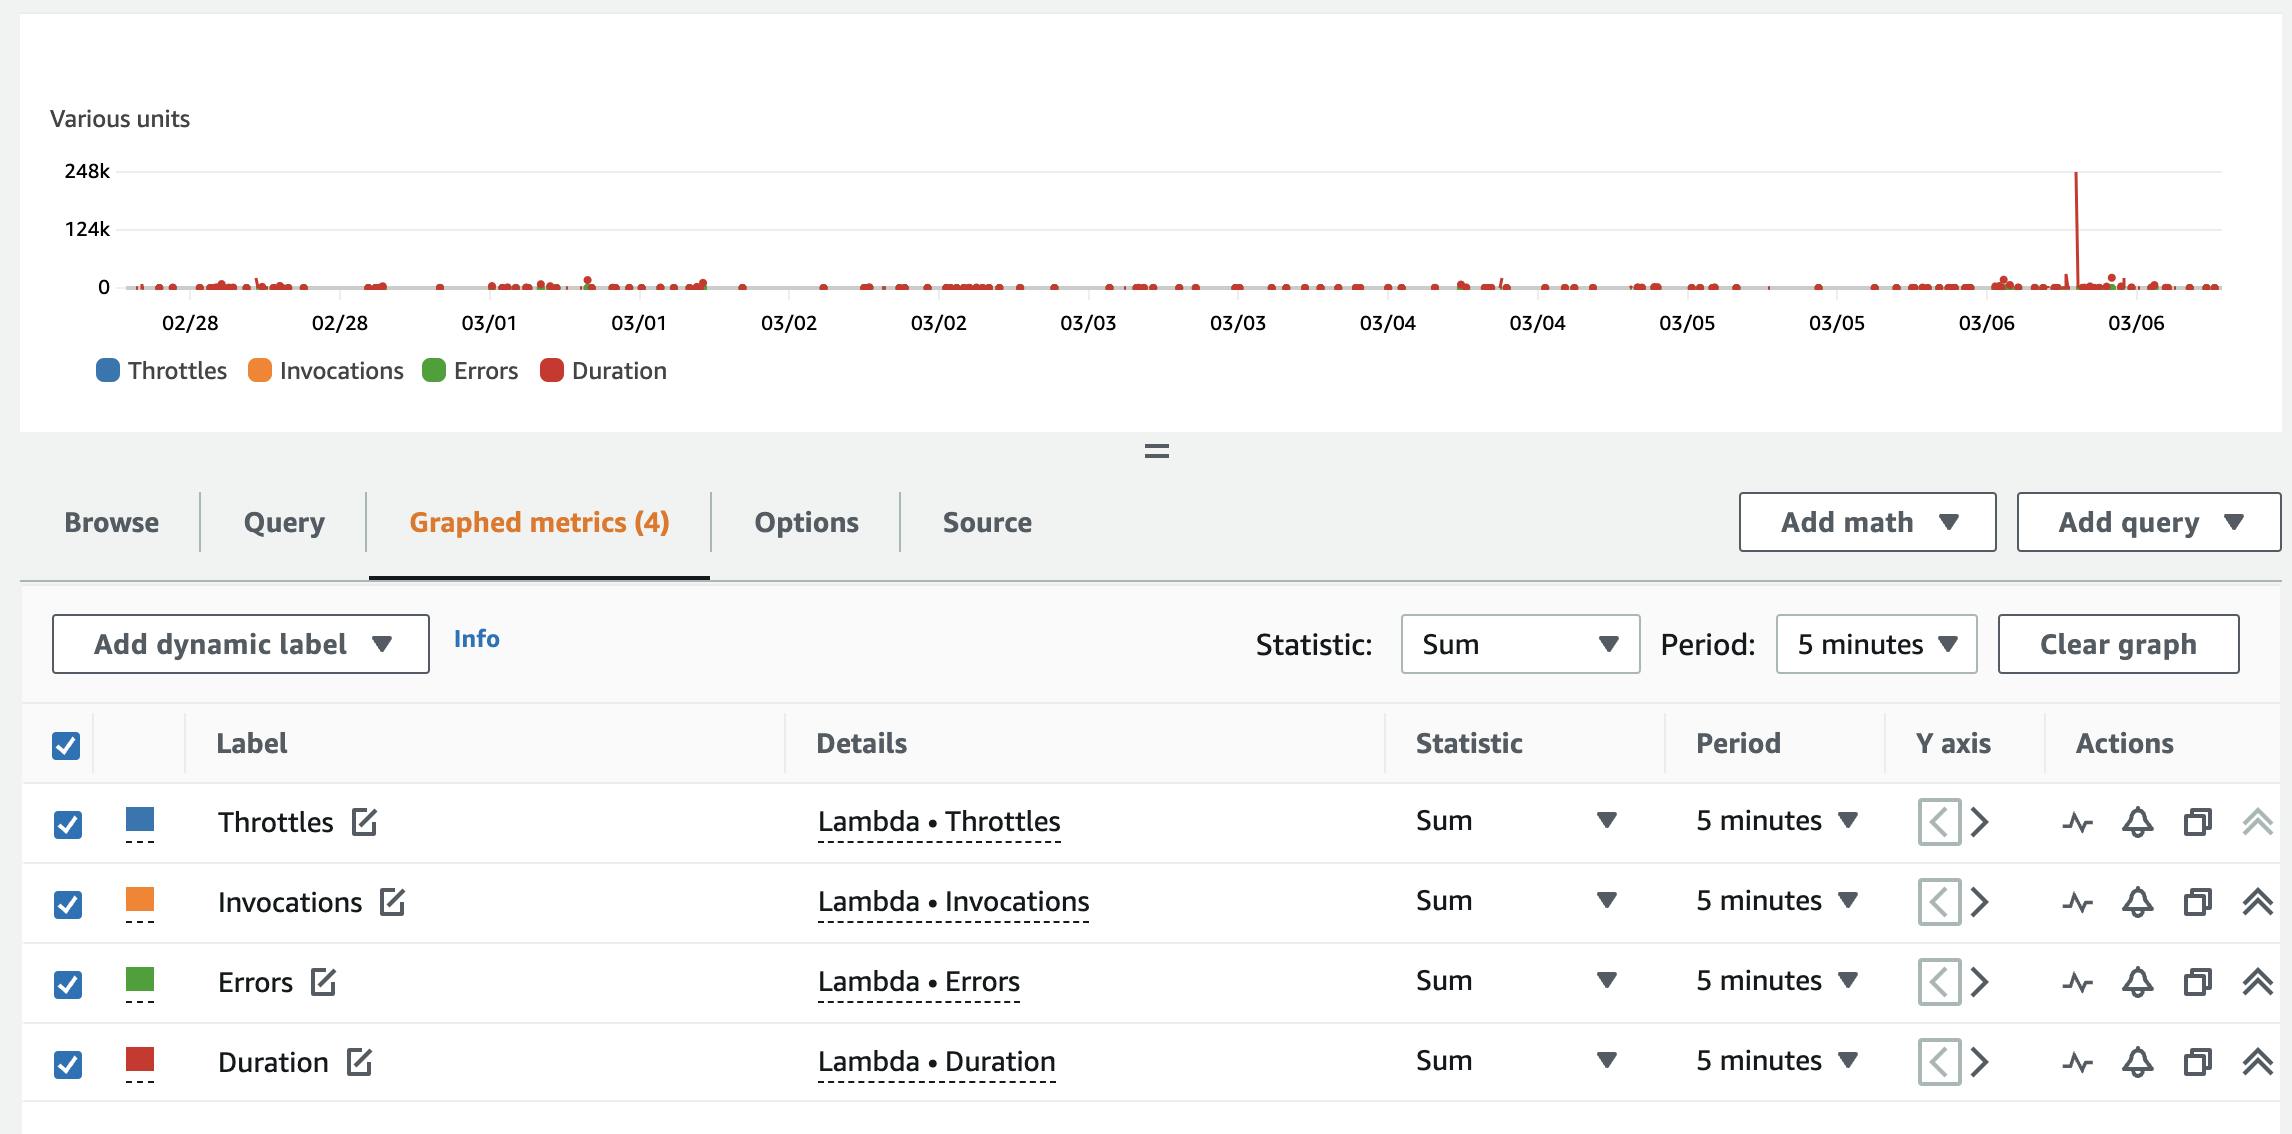
You can use these metrics to create visualizations or even CloudWatch alarms.
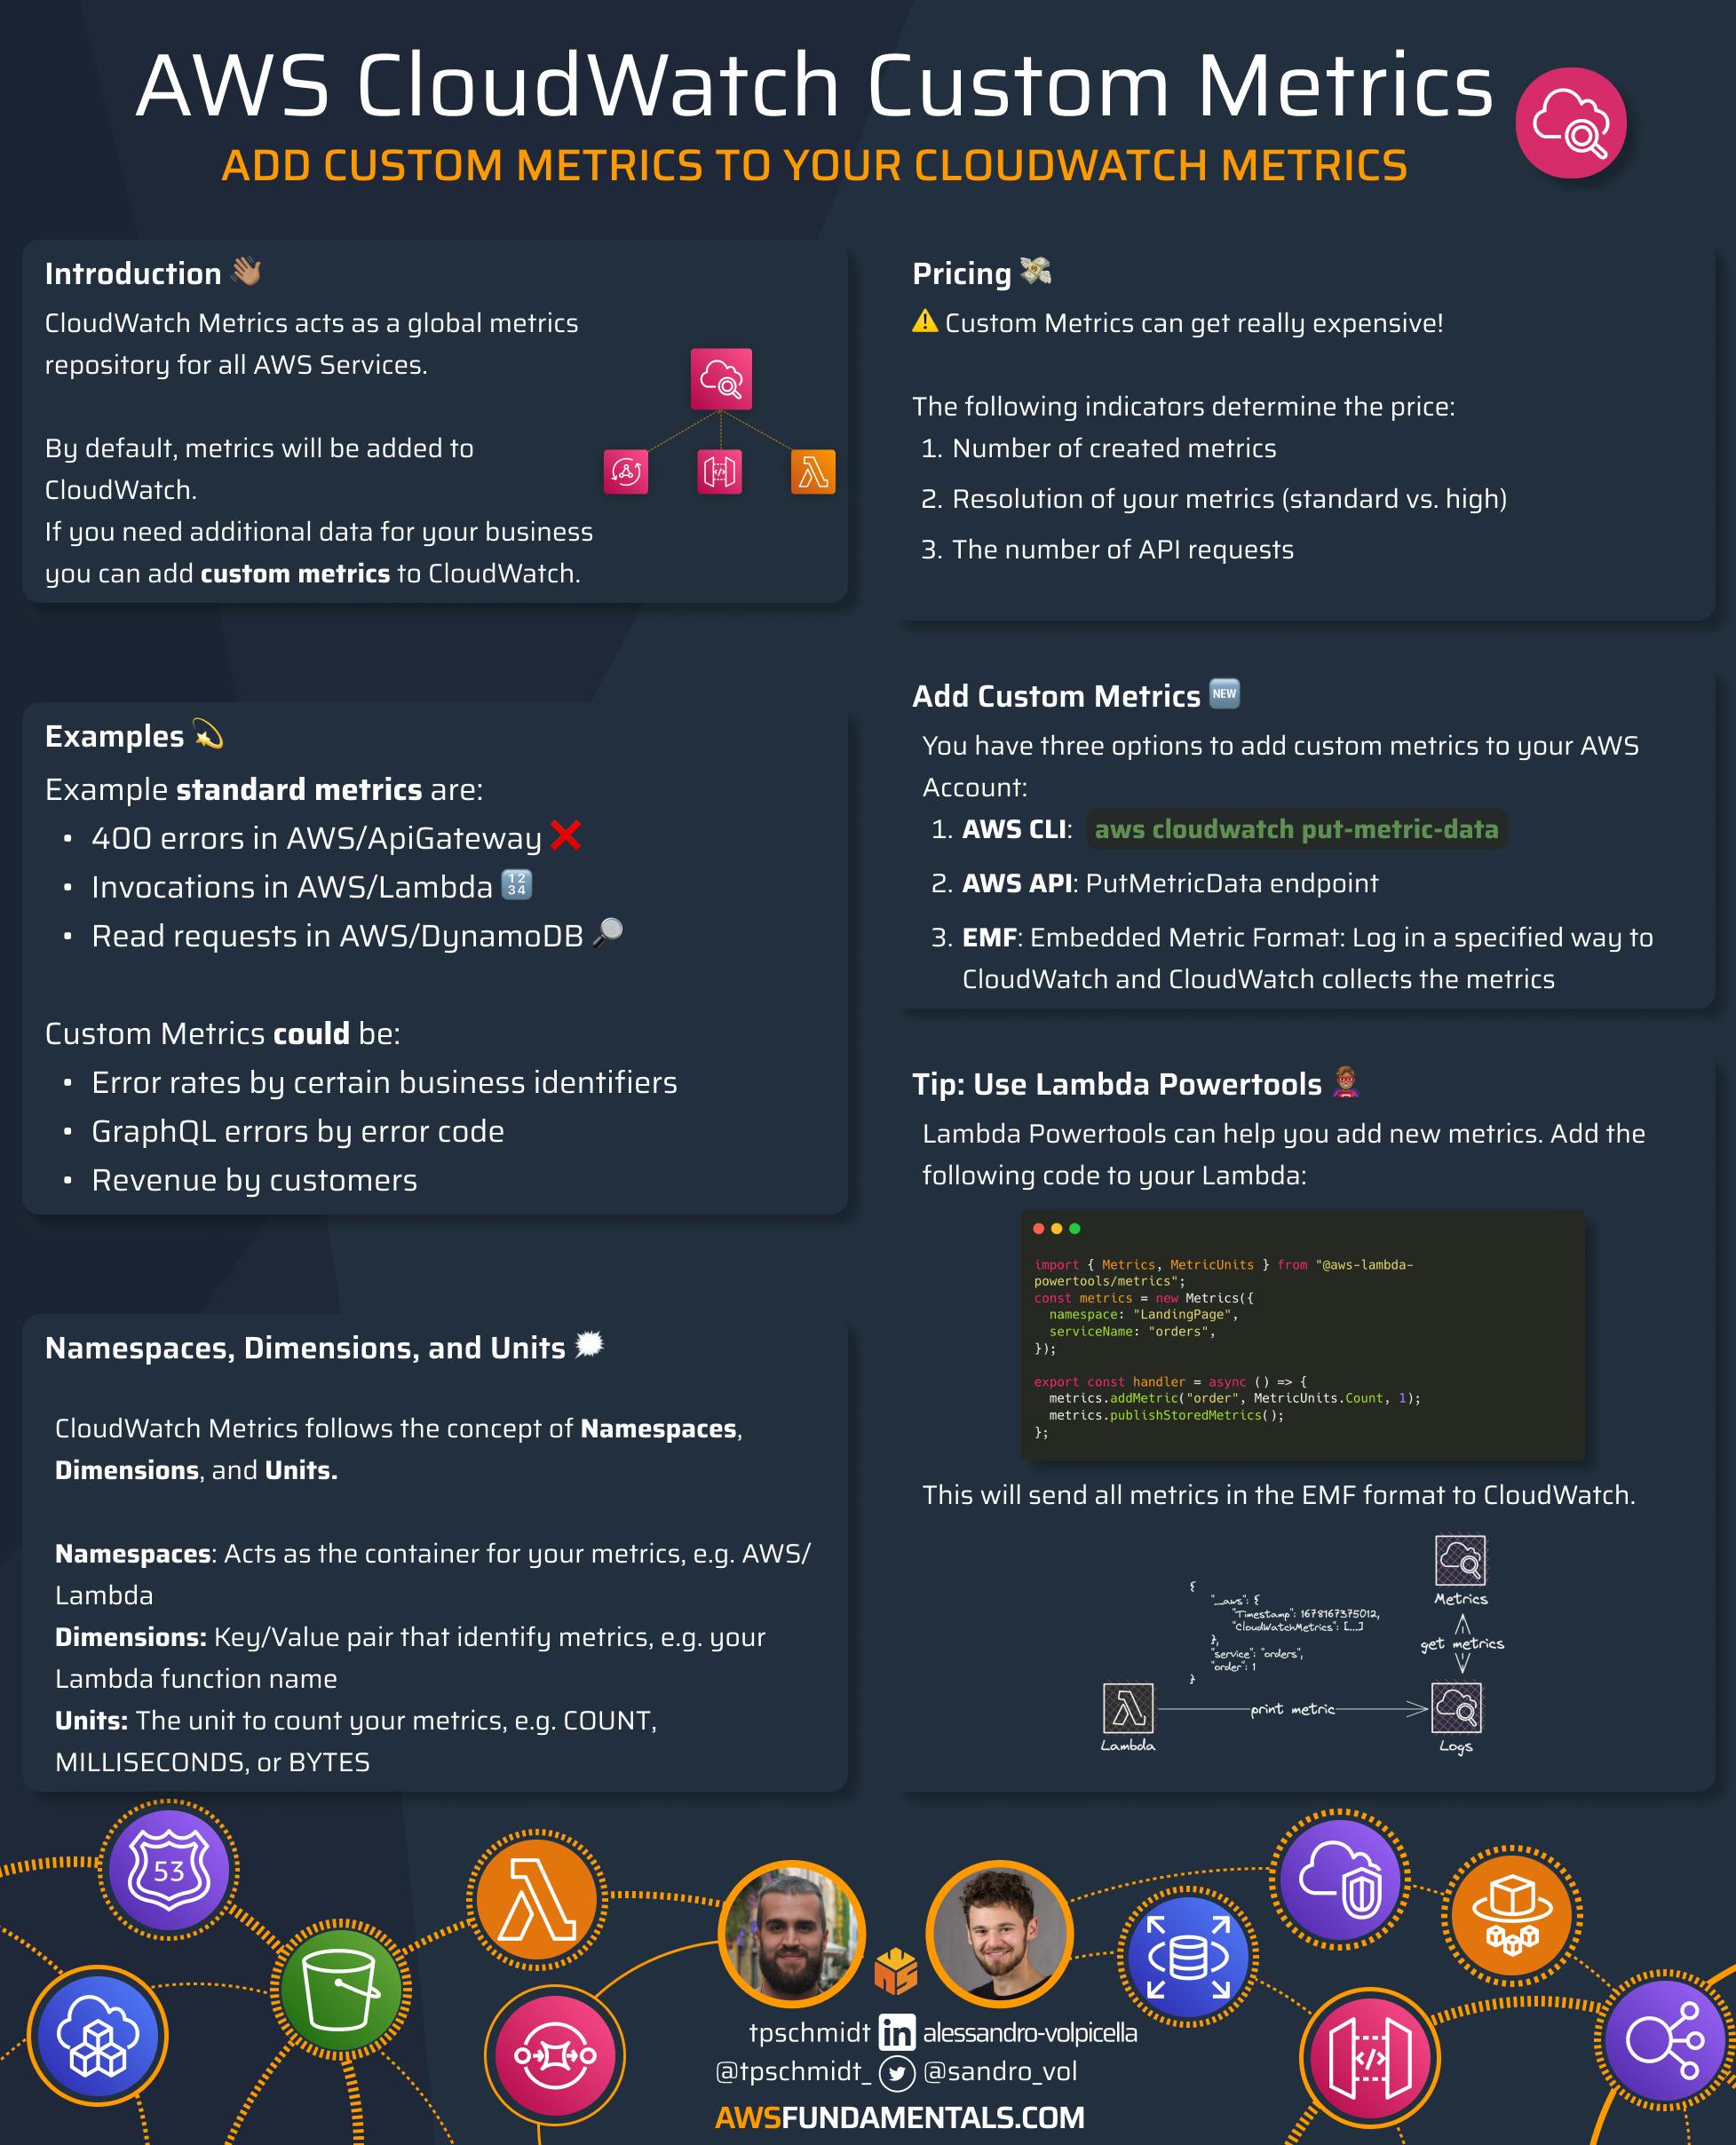
This post focuses on CloudWatch Metrics, especially on custom metrics.
Custom Metrics
What Are Custom Metrics?
CloudWatch sends pre-defined metrics for almost all AWS Services to CloudWatch. These metrics contain numbers like:
Errors in Lambda functions
CPU utilization of EC2 instances
400 error codes in API Gateway
However, it is often possible to monitor your applications in a more granular way. This is where custom metrics fit in. Common examples of custom metrics can be:
Saving business metrics like orders of an application
More granular error codes, for example in GraphQL APIs
Metrics with additional dimensions like user IDs
To monitor your applications more granularly you often need to add business-related metrics to your applications.
Custom Metric Concepts - Dimensions, Namespaces, and Resolutions
In Amazon CloudWatch, metric namespaces, dimensions, and units are used to organize and describe metrics. Understanding these concepts is essential for creating and analyzing metrics effectively.
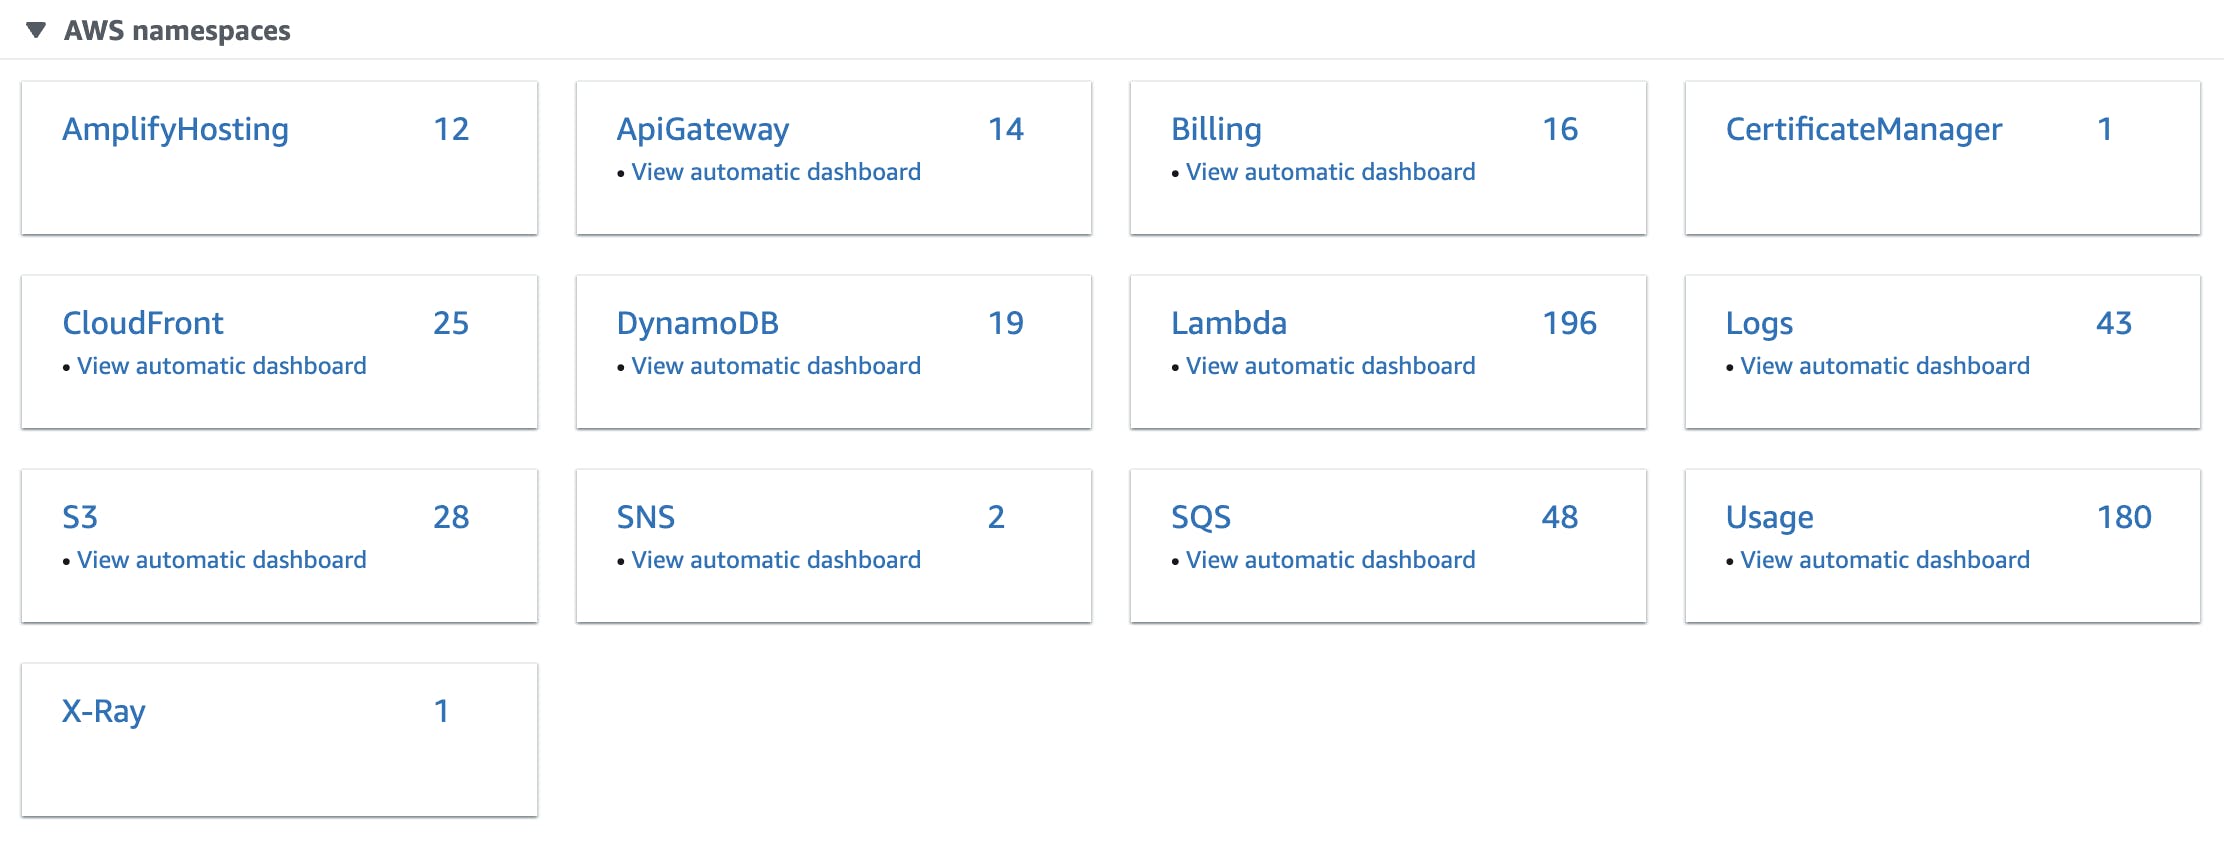
Metric Namespace
A metric namespace is a container for metrics that share a similar purpose or belong to the same application or service. Namespace names are unique within your AWS account and are used to group related metrics together.
For example, you might use a namespace called "MyApp/ServerMetrics" to group all server-related metrics for your application. Namespaces can be created when defining custom metrics, and you can also use predefined namespaces for AWS services.
Example namespaces within AWS are:
AWS/ApiGateway: Metrics for monitoring Amazon API Gateway usage and performance.
AWS/DynamoDB: Metrics for monitoring Amazon DynamoDB usage and performance.
AWS/Lambda: Metrics for monitoring AWS Lambda usage and performance.
AWS/RDS: Metrics for monitoring Amazon Relational Database Service (RDS) usage and performance.
AWS/SNS: Metrics for monitoring Amazon Simple Notification Service (SNS) usage and performance.
AWS/SQS: Metrics for monitoring Amazon Simple Queue Service (SQS) usage and performance.
Metric Dimensions
Metric dimensions are used to provide additional context to your metrics. They are key/value pairs that can be used to filter and group metrics.
Dimensions can be thought of as tags that help you identify and categorize metrics. For example, you might use dimensions such as "InstanceID", "Environment", or "Region" to identify specific instances or resources that the metric relates to.
You can define up to 10 dimensions per metric, and each dimension can have up to 10 values.
Dimensions in your Lambda metrics can be the function name or resource for example.
Metric Units
Metric units are used to describe the type of data being collected by a metric. Units help standardize metric data and provide a common language for interpreting metrics.
Amazon CloudWatch supports a wide range of metric units, including counts, bytes, seconds, and percentages, among others.
Choosing the appropriate unit for your metric is important to ensure that the data collected is accurate and meaningful.
Lambda Invocation Count: Count
Lambda Duration: Miliseconds
Some example units can be seen here:
declare enum MetricUnits {
    Seconds = "Seconds",
    Microseconds = "Microseconds",
    Milliseconds = "Milliseconds",
    Bytes = "Bytes",
    Kilobytes = "Kilobytes",
    Megabytes = "Megabytes",
    Gigabytes = "Gigabytes",
    Terabytes = "Terabytes",
    Bits = "Bits",
    Kilobits = "Kilobits",
    Megabits = "Megabits",
    Gigabits = "Gigabits",
    Terabits = "Terabits",
    Percent = "Percent",
    Count = "Count",
    BytesPerSecond = "Bytes/Second",
    KilobytesPerSecond = "Kilobytes/Second",
    MegabytesPerSecond = "Megabytes/Second",
    GigabytesPerSecond = "Gigabytes/Second",
    TerabytesPerSecond = "Terabytes/Second",
    BitsPerSecond = "Bits/Second",
    KilobitsPerSecond = "Kilobits/Second",
    MegabitsPerSecond = "Megabits/Second",
    GigabitsPerSecond = "Gigabits/Second",
    TerabitsPerSecond = "Terabits/Second",
    CountPerSecond = "Count/Second"
}
Best Practices for Using Metric Namespaces, Dimensions, and Units
When creating metrics in AWS CloudWatch, it is important to follow some best practices to ensure that they are accurate, reliable, and easy to analyze. Here are some tips for using metric namespaces, dimensions, and units effectively:
Choose meaningful and descriptive namespace names that reflect the purpose of the metric. Try to group your metrics within namespaces.
Use dimensions to provide additional context to your metrics and make them easier to analyze. Don't overdo it on dimensions.
Choose the correct unit to measure your metric.
Be consistent in your use of namespaces, dimensions, and units. Once you change them the metrics won't belong together anymore.
How to add Custom Metrics?
CloudWatch allows you to publish custom metrics via the API, CLI, or by logging in the Embedded Metric Format (EMF). These metrics will be saved as their own category and namespace within CloudWatch.
CLI
You can use the CLIs put-metric-data program for adding custom metrics. Here is an example from the AWS documentation:
aws cloudwatch put-metric-data --metric-name PageViewCount --namespace MyService --value 2 --timestamp 2016-10-20T12:00:00.000Z

aws cloudwatch put-metric-data --metric-name PageViewCount --namespace MyService --value 4 --timestamp 2016-10-20T12:00:01.000Z

aws cloudwatch put-metric-data --metric-name PageViewCount --namespace MyService --value 5 --timestamp 2016-10-20T12:00:02.000Z
Use the AWS API
You can also use CloudWatch's REST API to push data as Custom Metrics. The CLI is using the same API underneath.
The endpoint you need to use is PutMetricData. The syntax is similar to the CLI syntax. The more favorable way of adding metrics, however, is the next one.
Add Custom Metrics with the EMF Format
AWS launched 2019 a new way of adding metrics to CloudWatch in an asynchronous way.
The Embedded Metric Format (EMF) allows you to create metrics automatically from CloudWatch Logs. By printing your logs in a specialized format (👉🏽 EMF) CloudWatch takes these logs and adds them as a metric.
We'll suggest using a library for that such as the TypeScript Powertools. Simply add the following code to your Lambda code and you will see custom metrics:
import { Metrics, MetricUnits } from "@aws-lambda-powertools/metrics";

const metrics = new Metrics({
  namespace: "LandingPage",
  serviceName: "orders",
});

export const handler = async () => {
  metrics.addMetric("order", MetricUnits.Count, 1);
  metrics.publishStoredMetrics();
};
Once you execute the code in the Lambda function you will spot the following log in CloudWatch
{
    "_aws": {
        "Timestamp": 1678167375012,
        "CloudWatchMetrics": [
            {
                "Namespace": "LandingPage",
                "Dimensions": [
                    [
                        "service"
                    ]
                ],
                "Metrics": [
                    {
                        "Name": "order",
                        "Unit": "Count"
                    }
                ]
            }
        ]
    },
    "service": "orders",
    "order": 1
}
This is a great workshop if you want to learn more about EMF and its capabilities.
Check Custom Metrics
If this is the first time adding custom metrics it can take a while (~2-3 minutes) until they appear in CloudWatch.
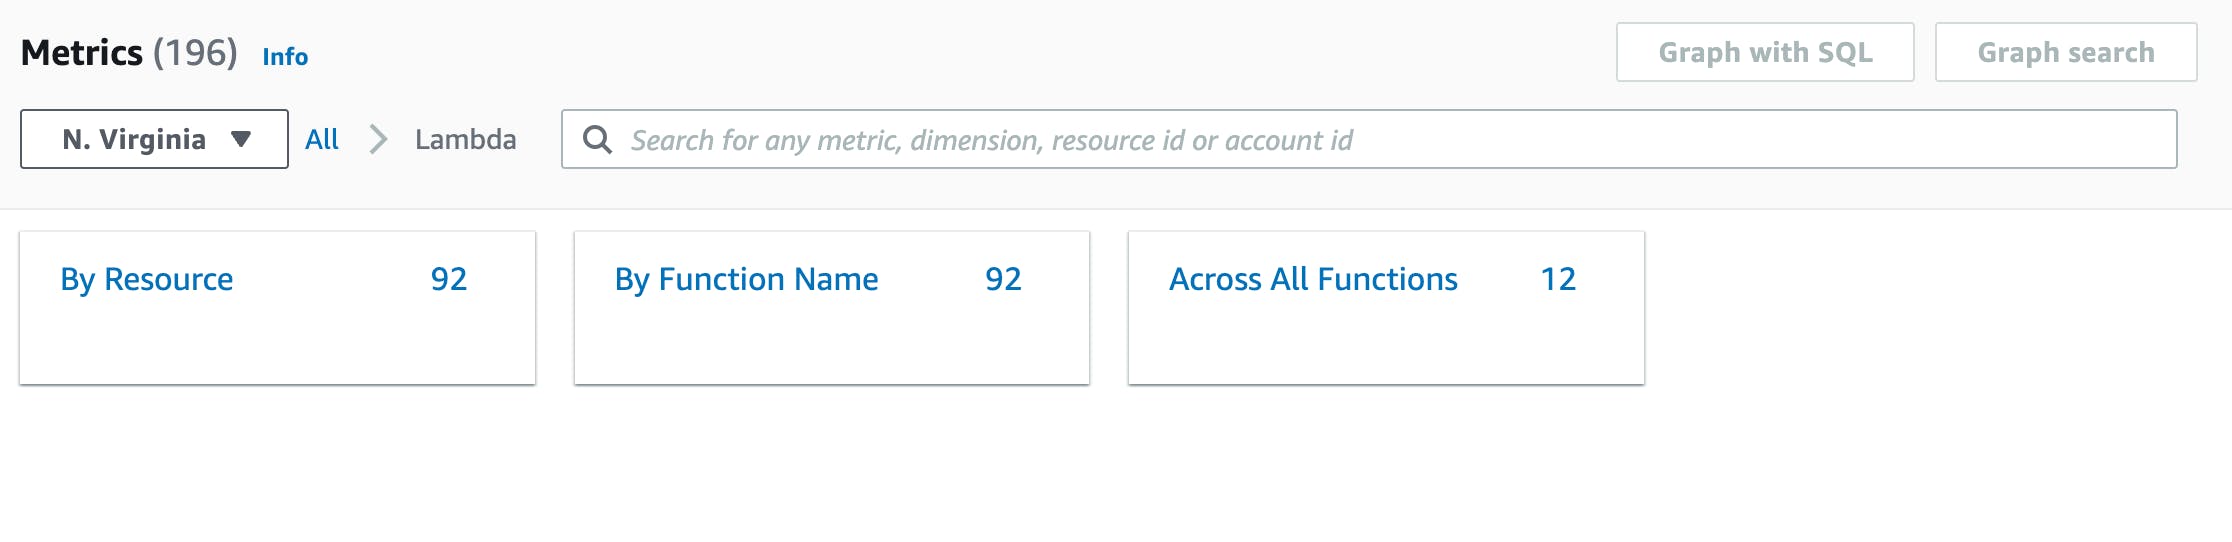
To see the custom metrics head over to the metrics overview in CloudWatch. You should see a new Custom Namespace called Landingpage.
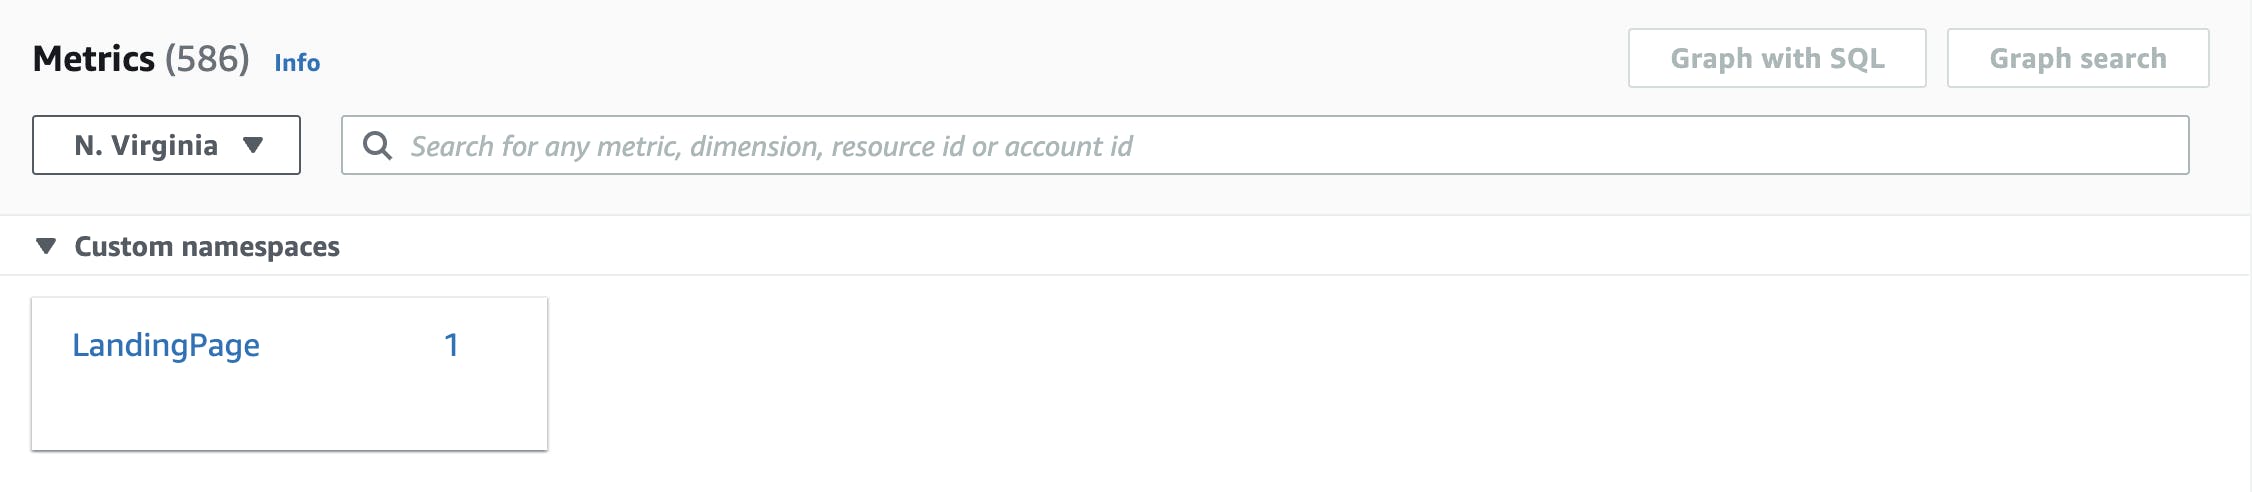
If you click on this namespace you will see your metrics.
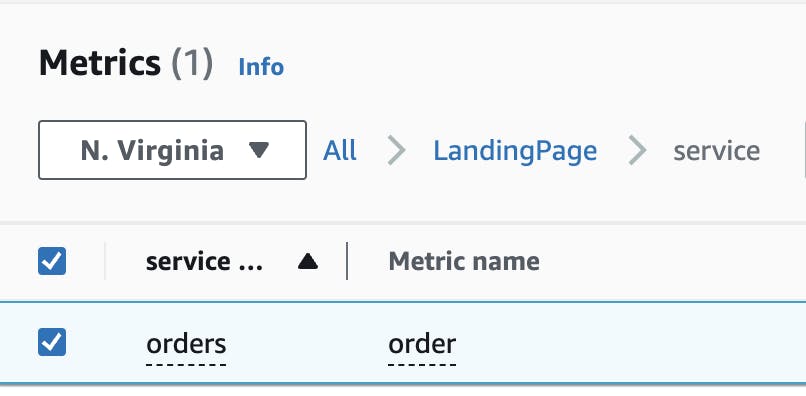
You've now added a custom metric 🎉
CloudWatch Custom Metrics Pricing
Custom metrics are amazing but be aware that they can get really costly over time. The pricing is based on the following:
Number of custom metrics created
The resolution of your metrics
The number of API requests (e.g.
PutMetricData)
Make sure to estimate your use case with AWS's pricing calculator
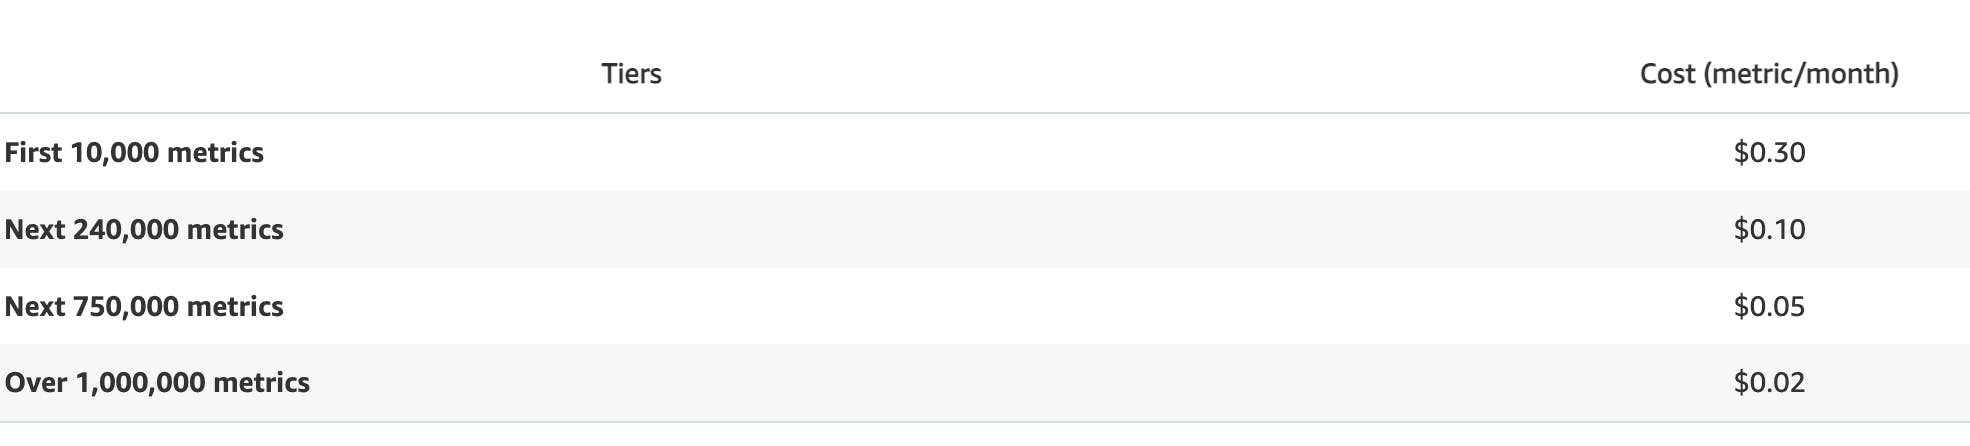
Custom Metric Pricing
The pricing for custom metrics is based on the number of metrics created and the frequency of data points. AWS charges $0.30 per custom metric per month for the first 10,000 metrics, and then $0.10 per custom metric per month for each additional metric.
Free Tier
If you're eligible for the free tier in AWS you can use up to 10 custom metrics for free. If you want to know more about free tiers and CloudWatch pricing in general check out this article.
That's it 🎉
Thank you for reading this article! Do you have any examples of custom metrics you have used in the past? Share them in the comments 👋🏽