


Table of contents
Introduction
CloudWatch is the primary logging and metrics service for AWS. Every AWS service logs data into CloudWatch.
CloudWatch gathers metrics, such as the quantity of Lambda invocations, available storage in your database, or the amount of CPU consumption by your ECS cluster. With these metrics, you can establish alarms for specific thresholds. If the available storage falls below a specific threshold, you will receive an alert. You can achieve the same behavior with custom metrics as well.
It is not always easy to keep an overview of all Logs, Metrics, and Alerts within your system. This is where CloudWatch Dashboards can help you immensely.
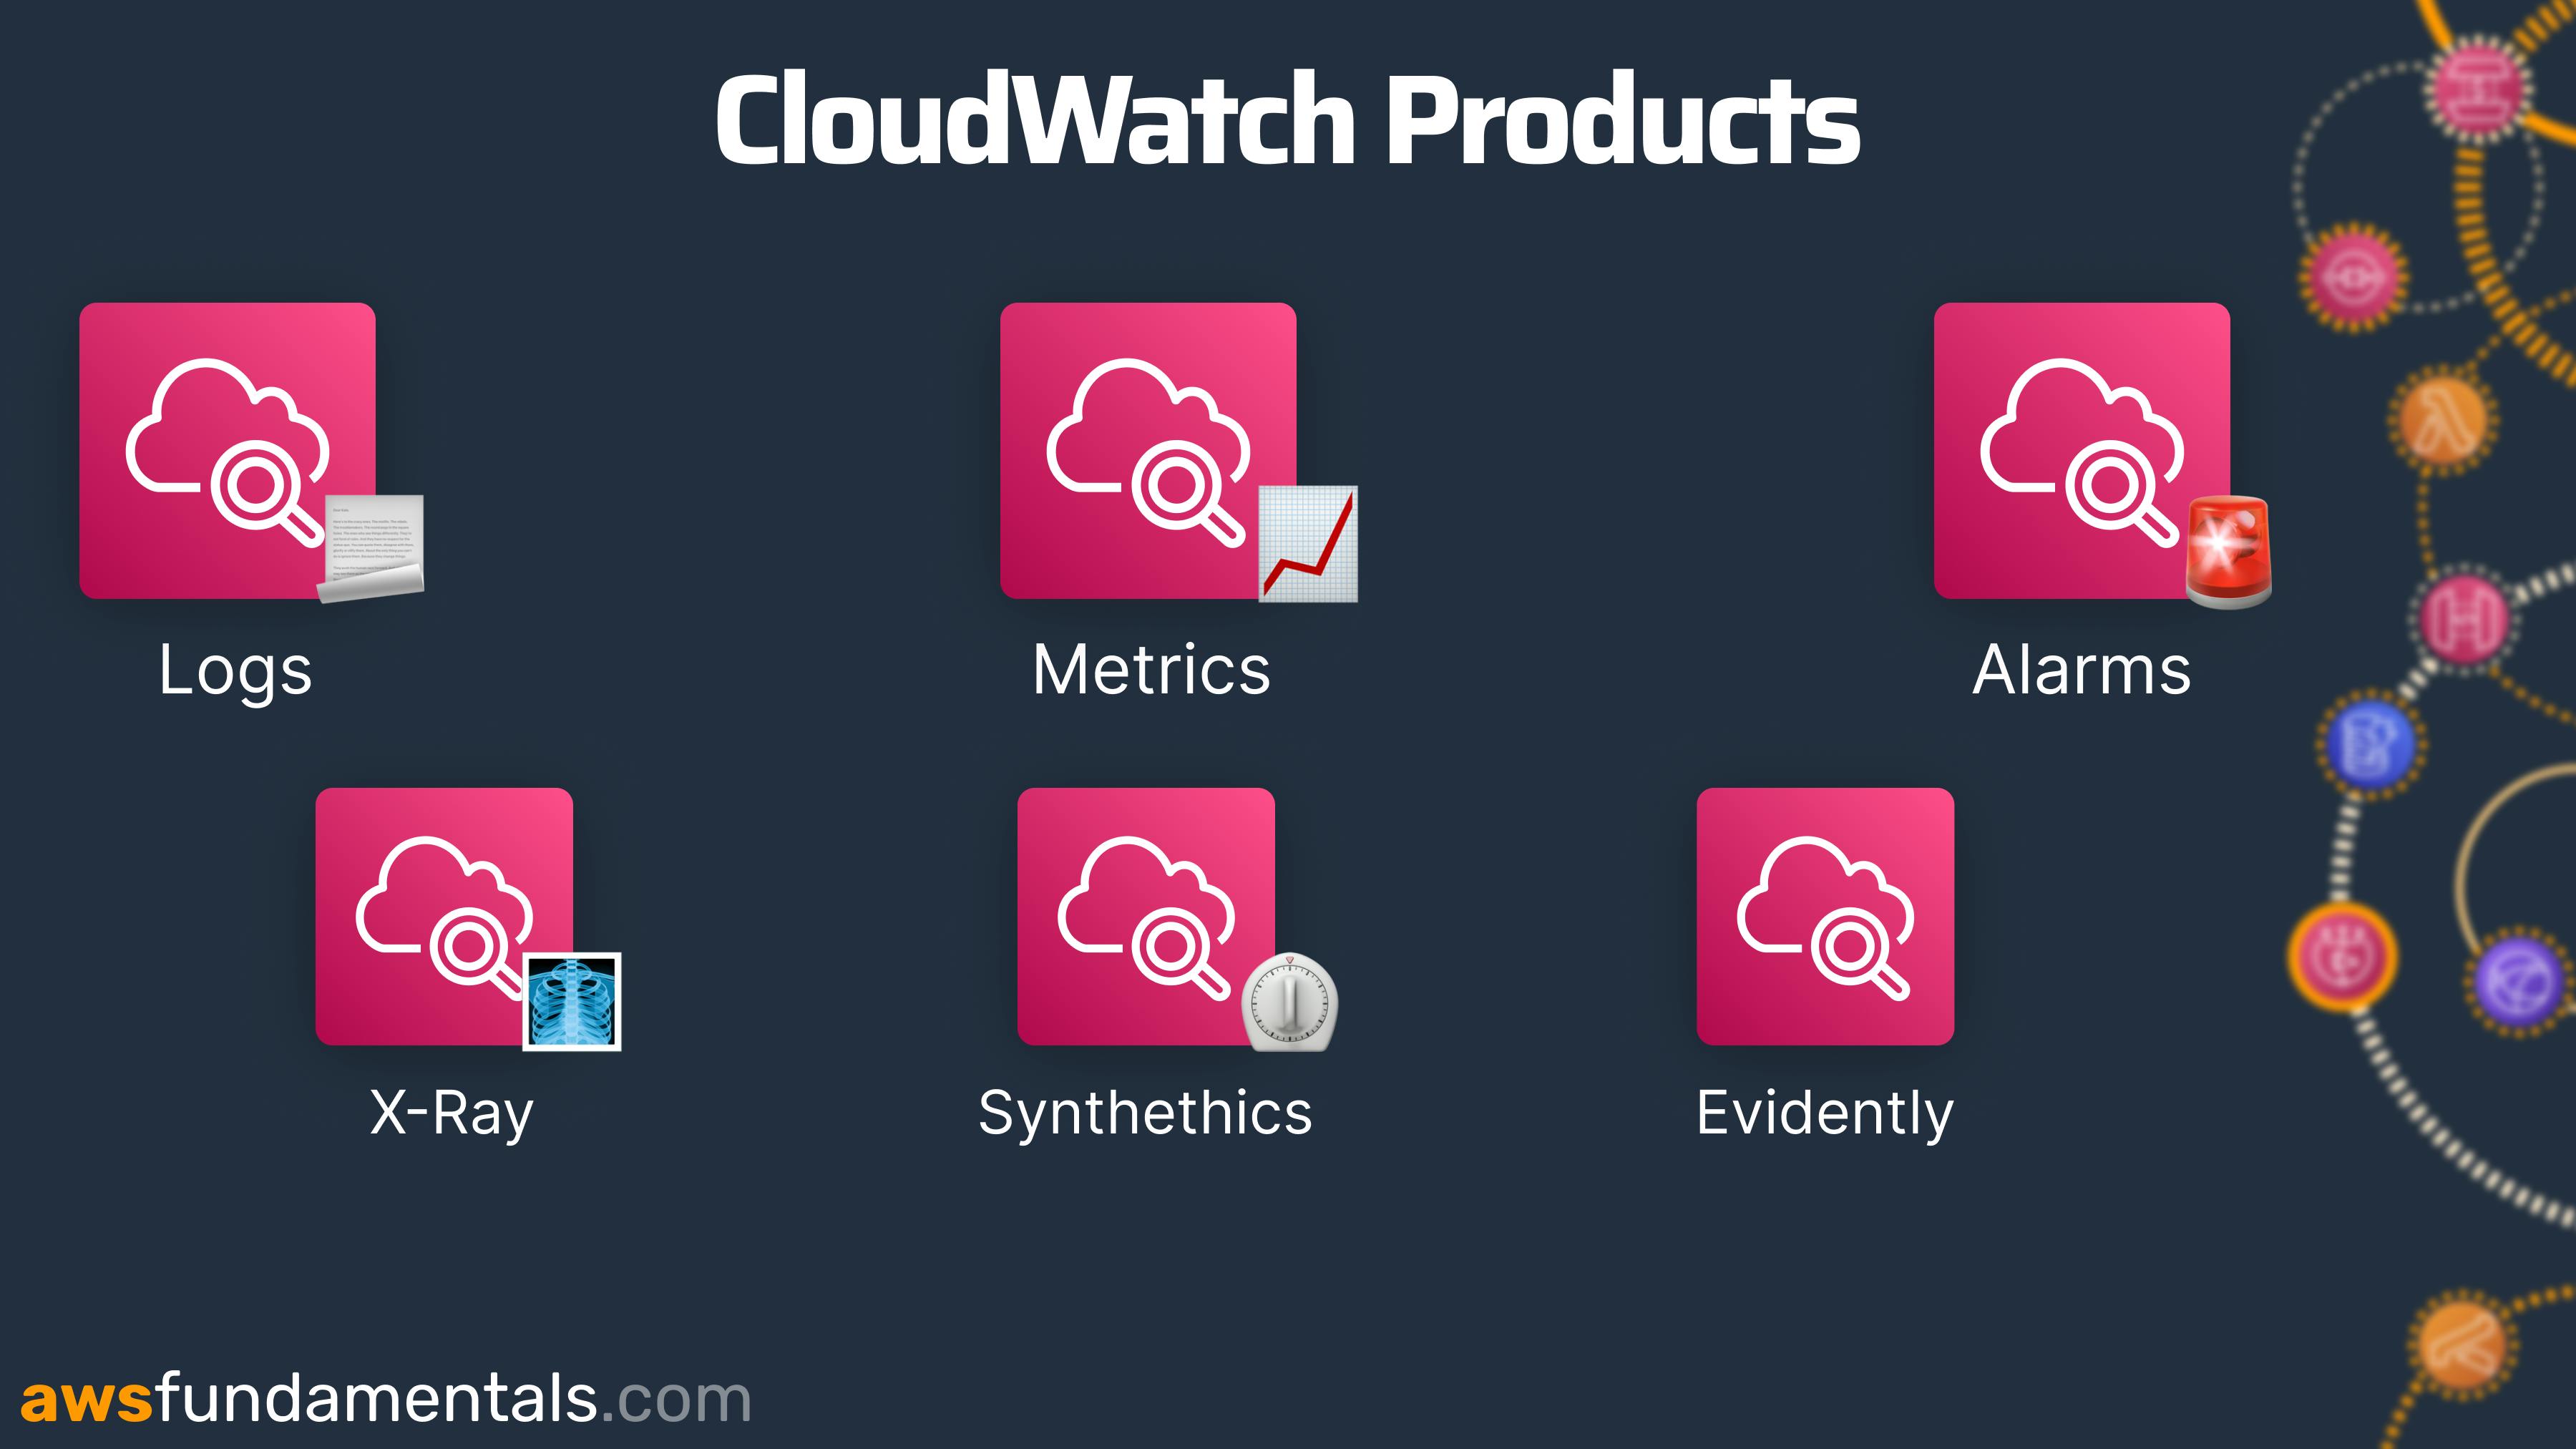
CloudWatch offers a wide range of products. This post specifically delves into the creation of dashboards for various services, including Logs, Metrics, and Alarms. Our main focus is guiding you through the process of dashboard creation. You can get an overview of all products in this article.
CloudWatch Dashboards
Dashboards give you the opportunity to get an overview of lots of different metrics and alarms at the same time.
You can add different widgets in the Dashboard. Your dashboard can be shared with interested stakeholders & teams. Let's see CloudWatch Dashboards in more detail.
Automatic Dashboards
The great thing about CloudWatch Dashboards is that AWS is creating automatic Dashboards for some of the services.
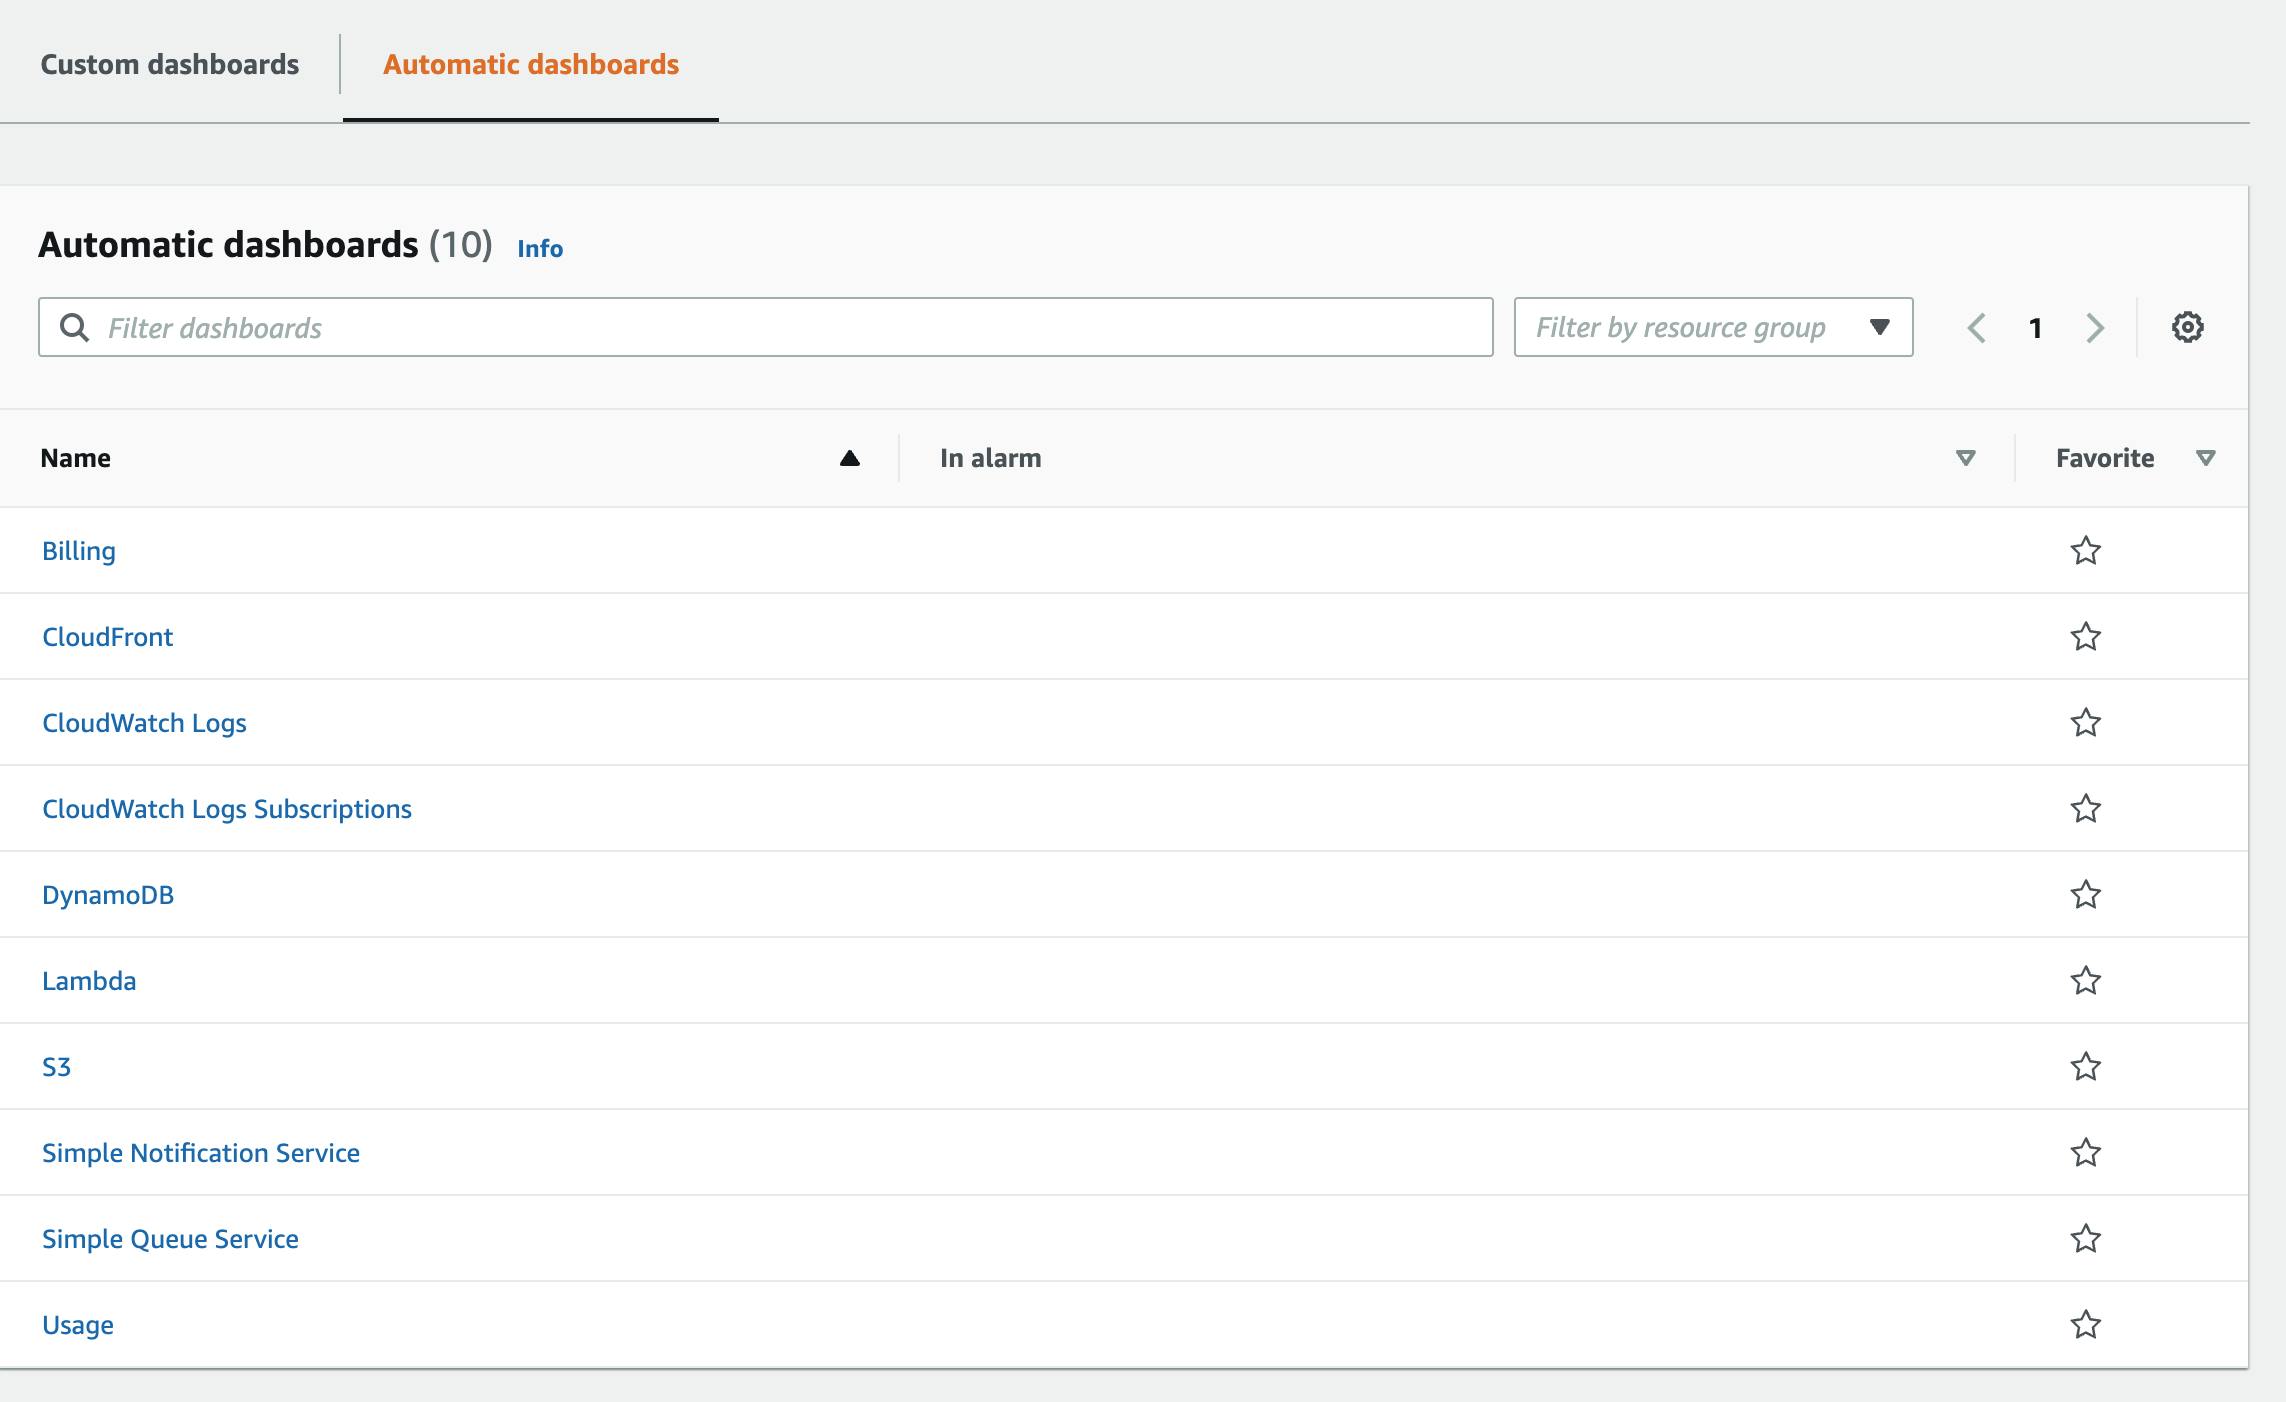
Head over to CloudWatch Dashboards and click on the Tab Automatic Dashboards. Here you can see Dashboards for the services:
Billing
CloudFront
CloudWatch Logs
CloudWatch Logs Subscriptions
DynamoDB
Lambda
S3
Simple Notification Service
Simple Queue Service
Usage
Lambda Dashboard
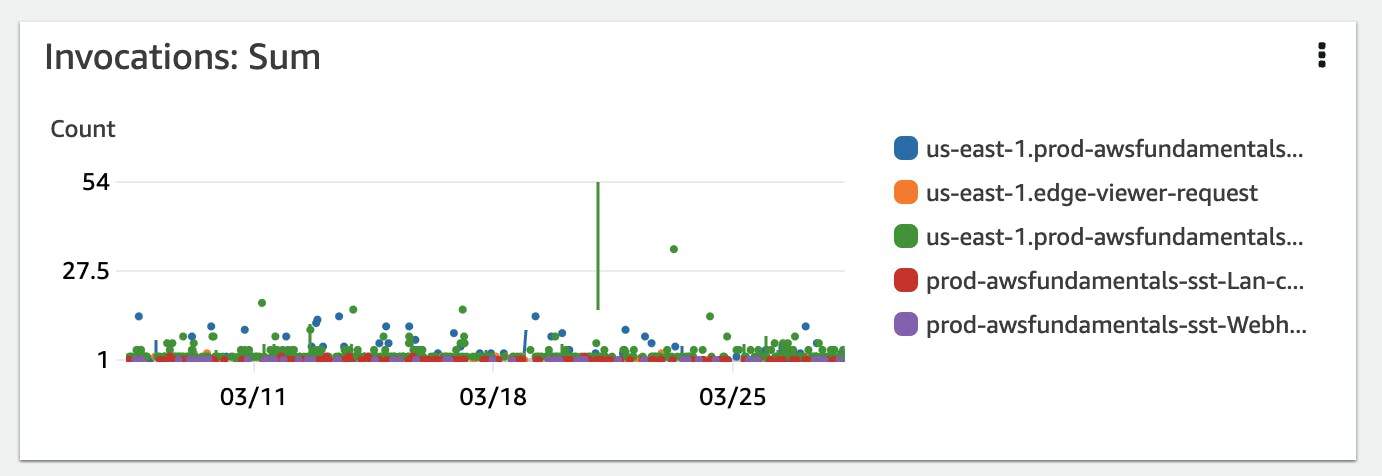
Let's take a look at the Lambda Dashboard.
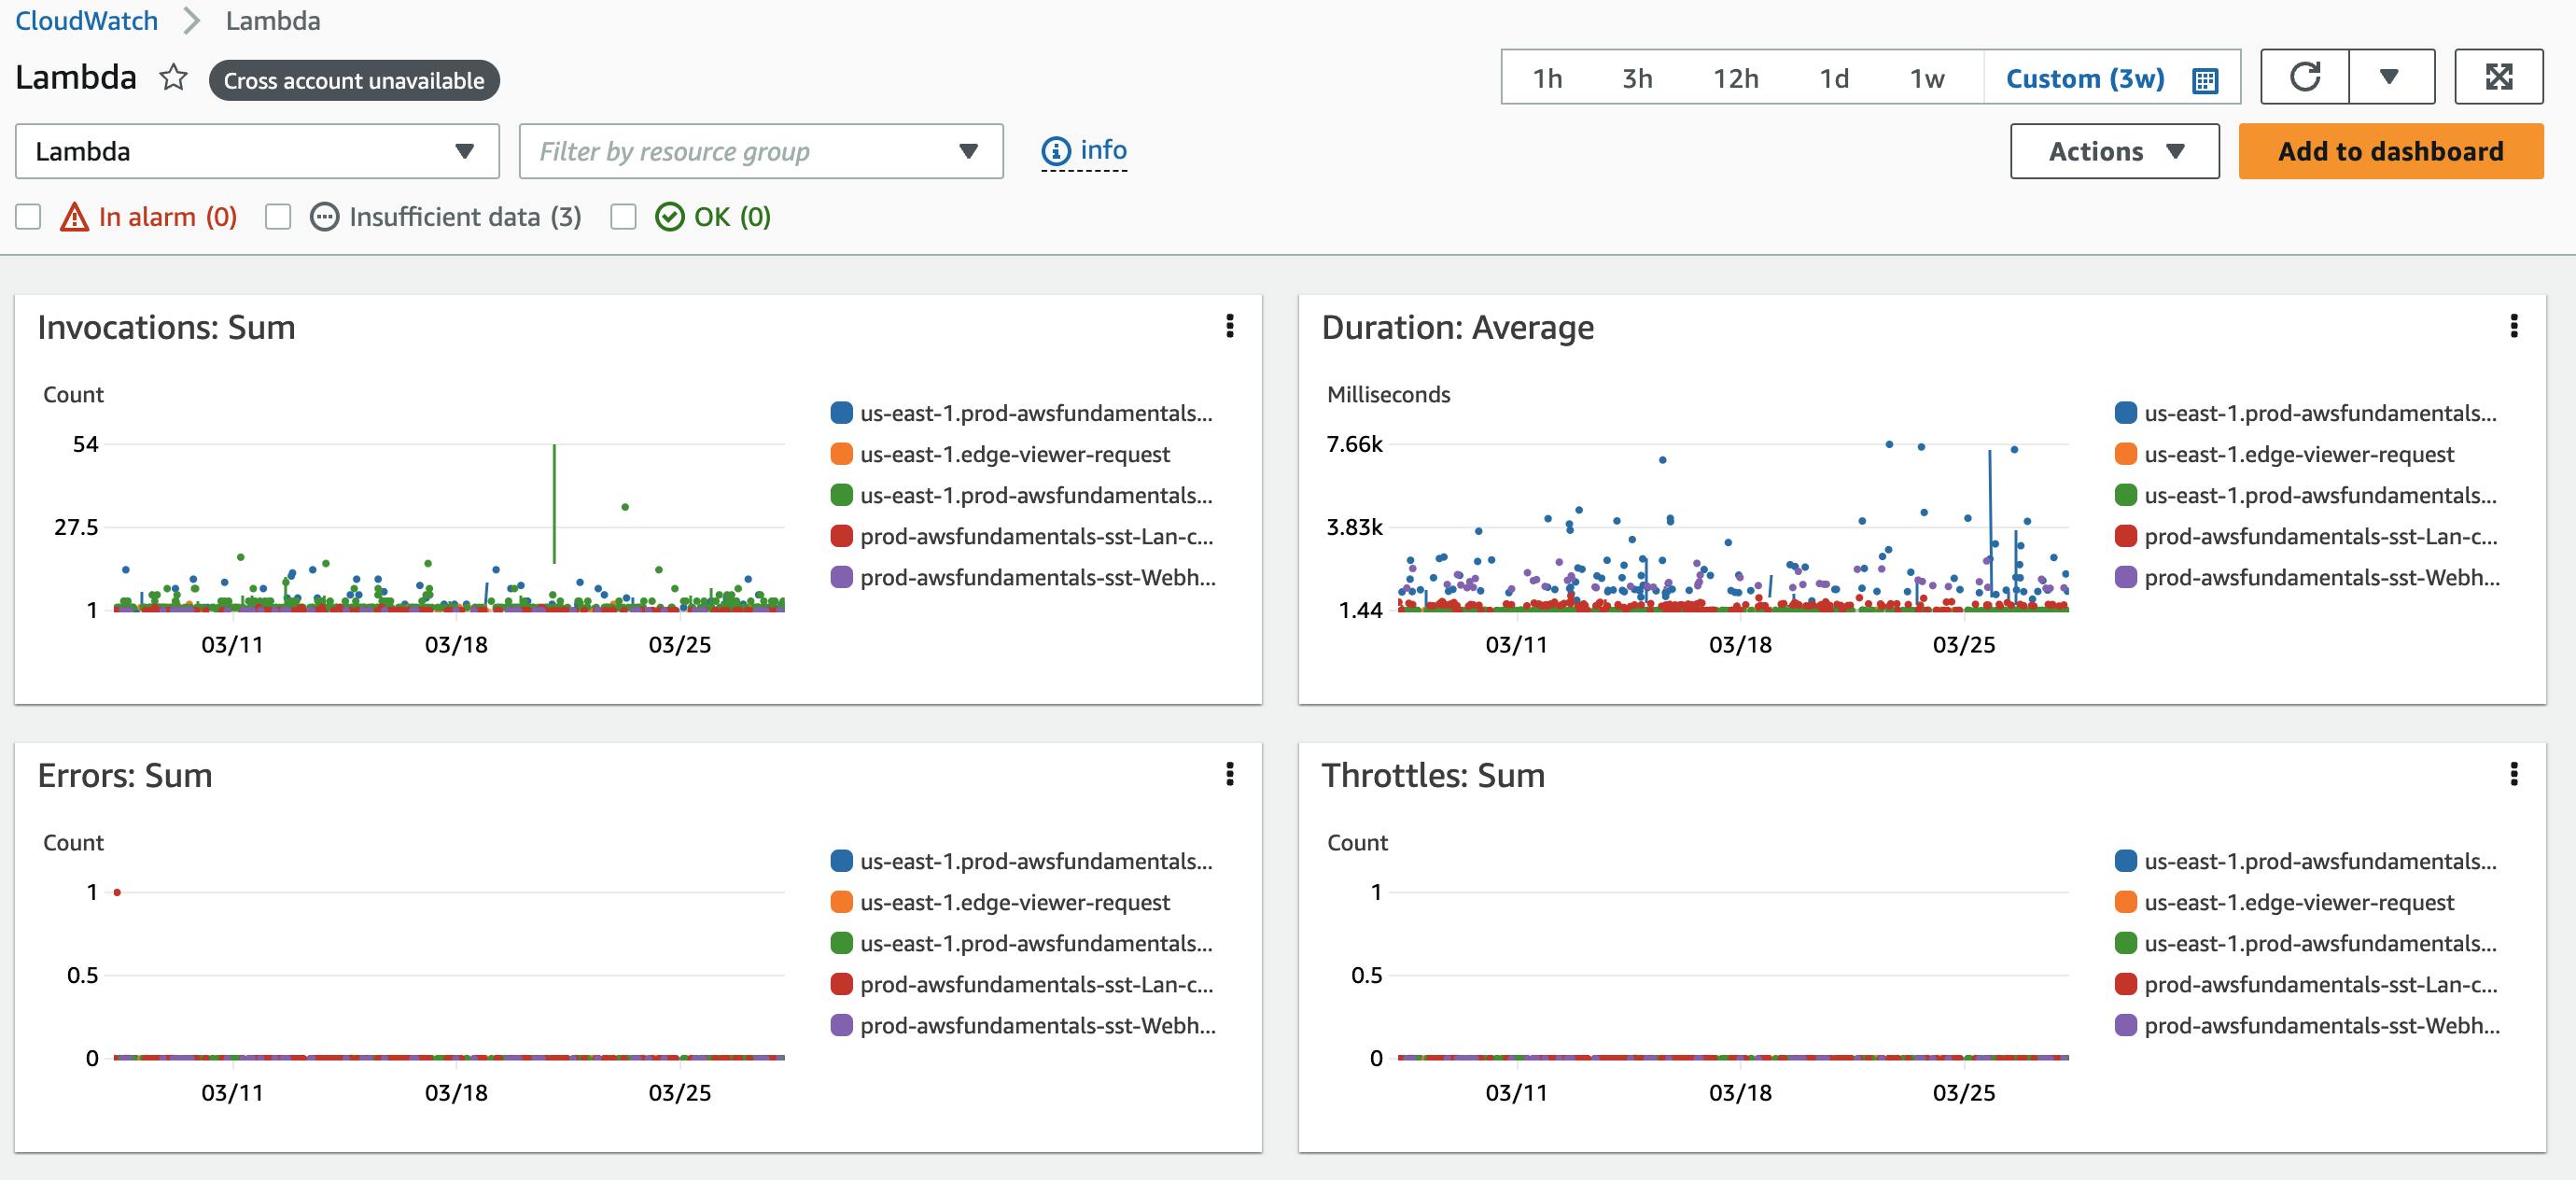
This Dashboard displays several metrics:
The sum of invocations
The average duration
The sum of errors
The sum of throttles
Widgets
One box (e.g. invocations: sum) is called a Widget. You can add several Widgets to one Dashboard.
Widgets can display Logs, Metrics, or Alarms. We will see that in more detail when we are creating our own Dashboard.
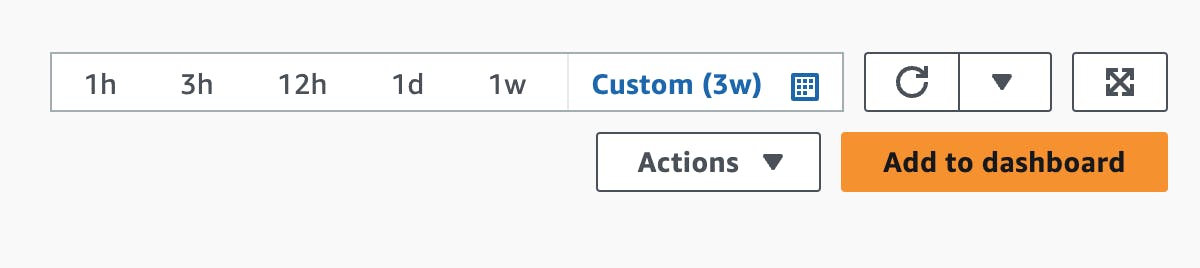
Timeframe
All data within your Dashboard is time-dependent. That means at different times you will see different metrics. To change the time you can go to the top right corner and either set your time relative to your current one, like the last 12 hours. Or you can set an absolute time.
Automatic Dashboard should give you a clue on which metrics it makes sense to look at. And the best part. They are completely free of charge. Check out the announcement post back in 2018 to get some more ideas.
Manual Dashboards
While Automatic Dashboards are good as a starting point. Your application doesn't exist only out of one service. It often consists of multiple services that interact highly with each other.
This is where Manual Dashboards help you a lot. Let's go to CloudWatch and have a look at creating a Dashboard.
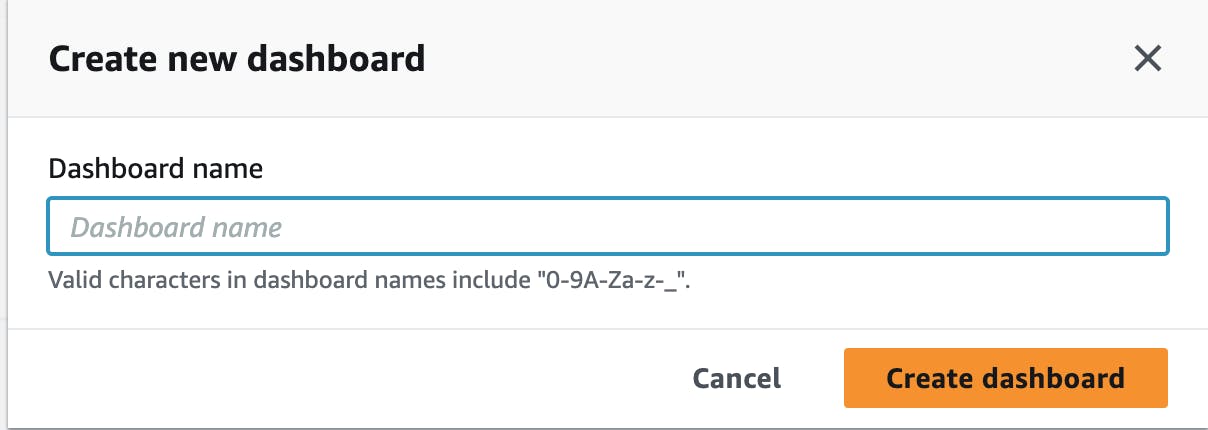
Click on Create new dashboard and enter a name.
You are now asked to add widgets to your dashboard. There are several types of widgets.
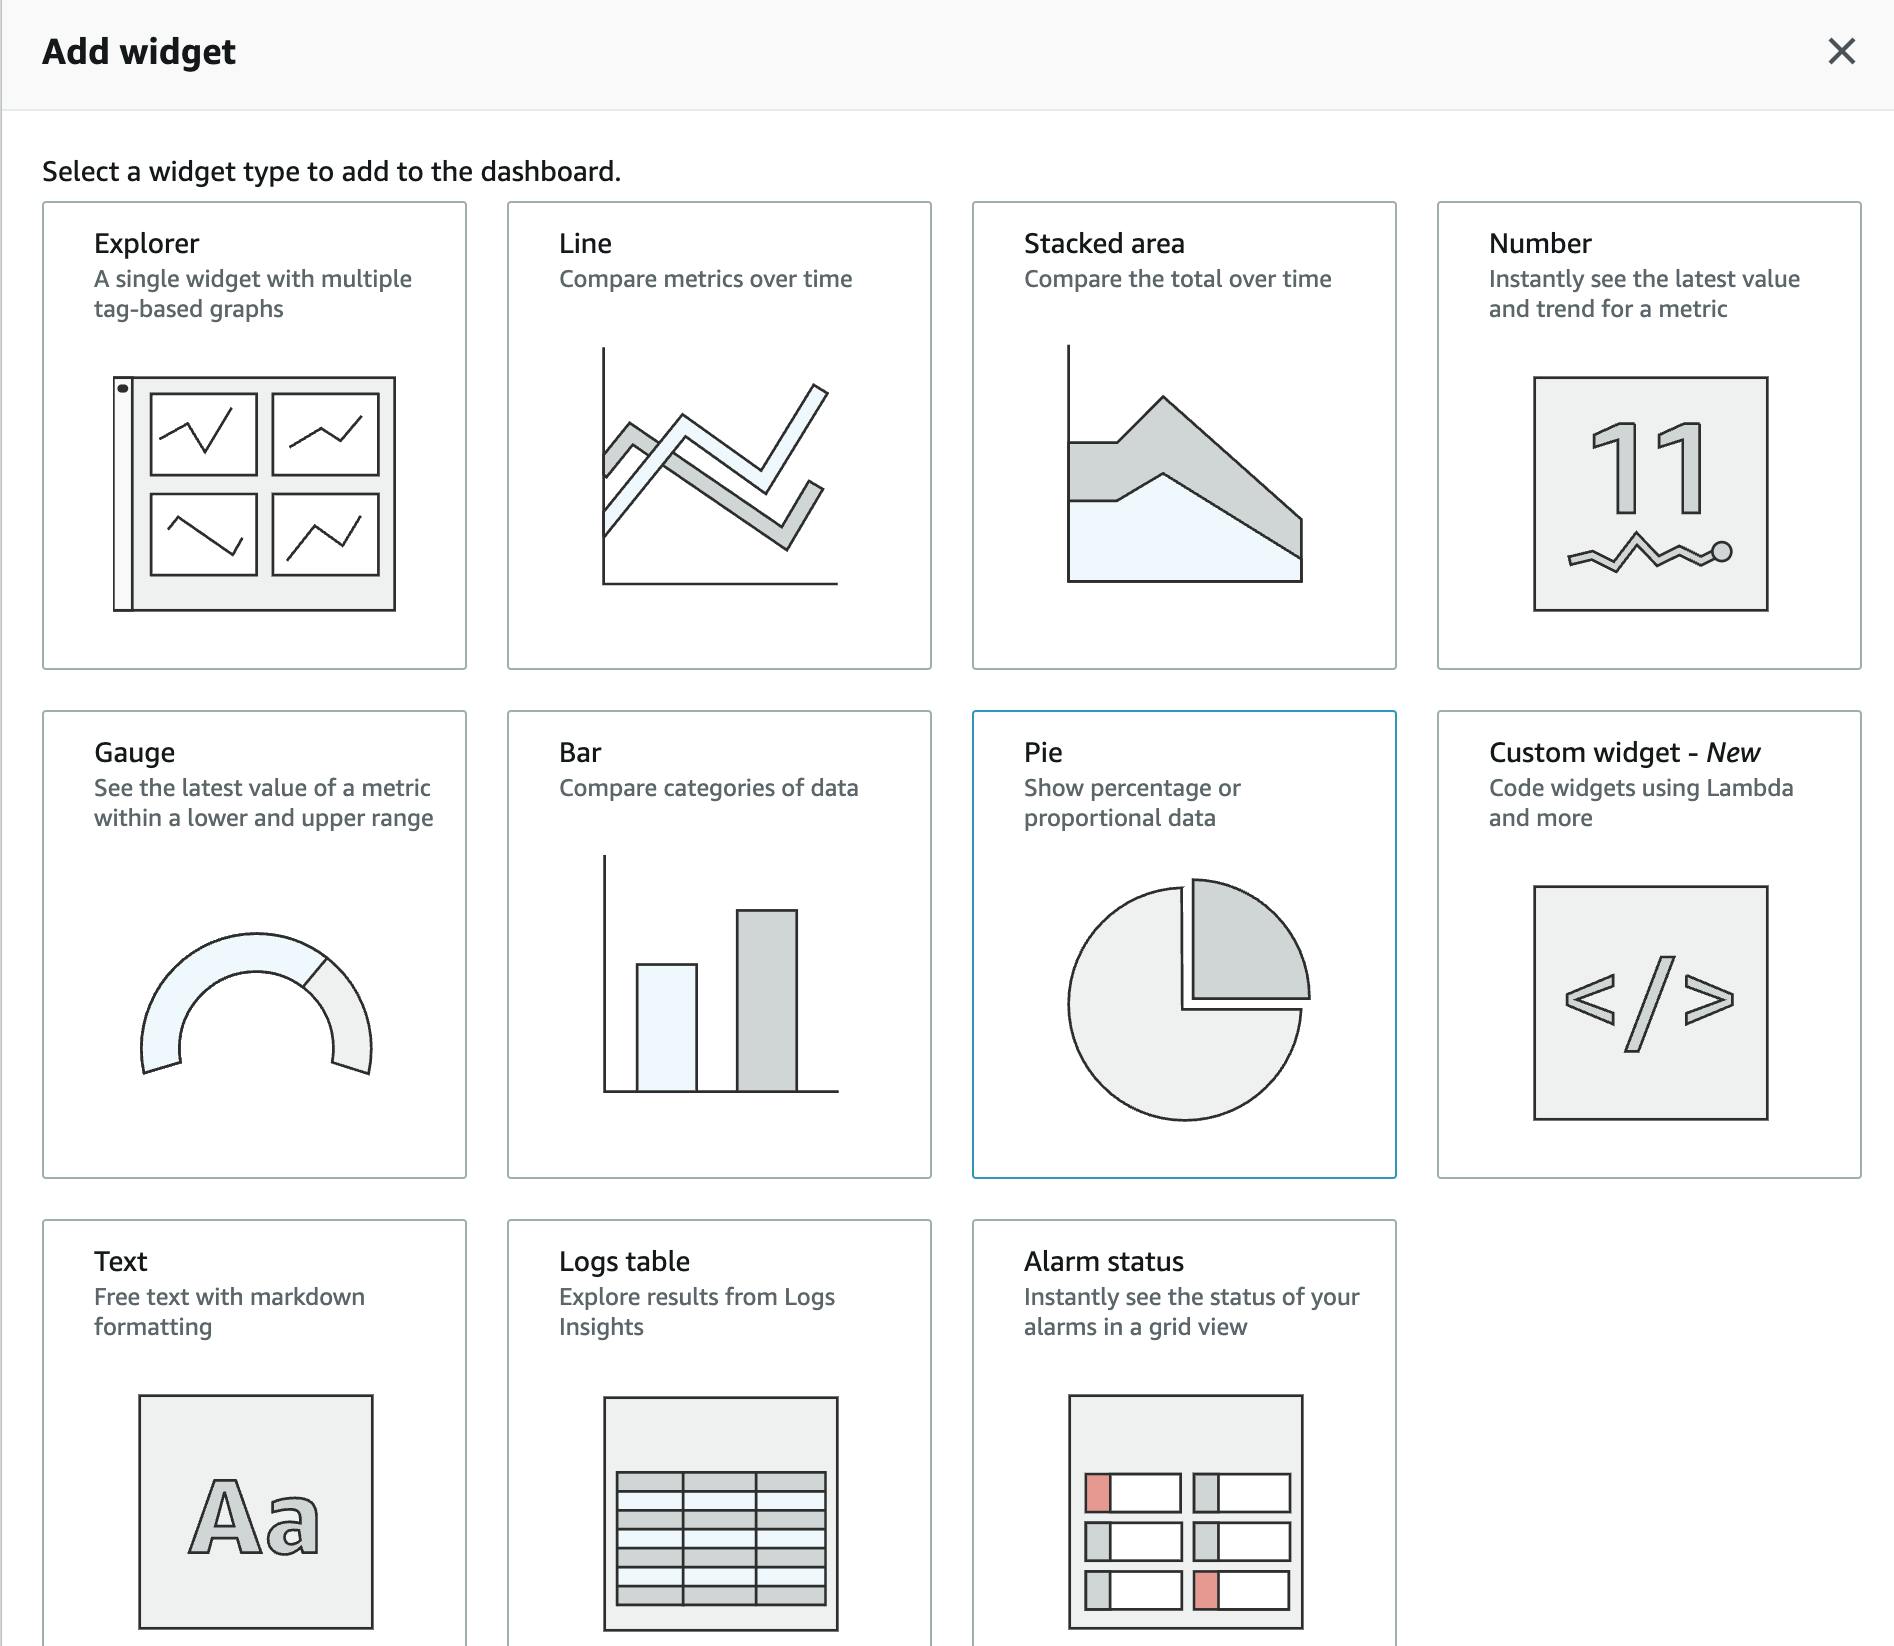
| Widget Type | Explanation |
| Explorer | A grid of metrics within one widget. Can be pre-filled or not. |
| Line | Line charts to compare several metrics. |
| Stacked area | Line charts with filled stacks to compare total values over time. |
| Number | Single numbers to see the latest value or trend. |
| Gauge | See metrics with a lower and upper range. |
| Bar | A bar chart to compare categories of data |
| Pie | Show percentage or relative data |
| Custom Widgets | Create your own widgets with Lambda functions |
| Text | Free text fields with Markdown editing. |
| Logs Table | Display CloudWatch logs. |
| Alarm Status | Show the status of your alarms in a grid. |
Step-By-Step Creating Dashboards
Let's start adding some Widgets to the Dashboard. Our goal is to get an overview of our landing page. For that, we first add an explorer widget for Lambda. Lambda is taking care of adding new subscribers to our email newsletter.
Pre-Filled Explorer Widget
We can choose a Pre-filled explorer widget for the service Lambda.
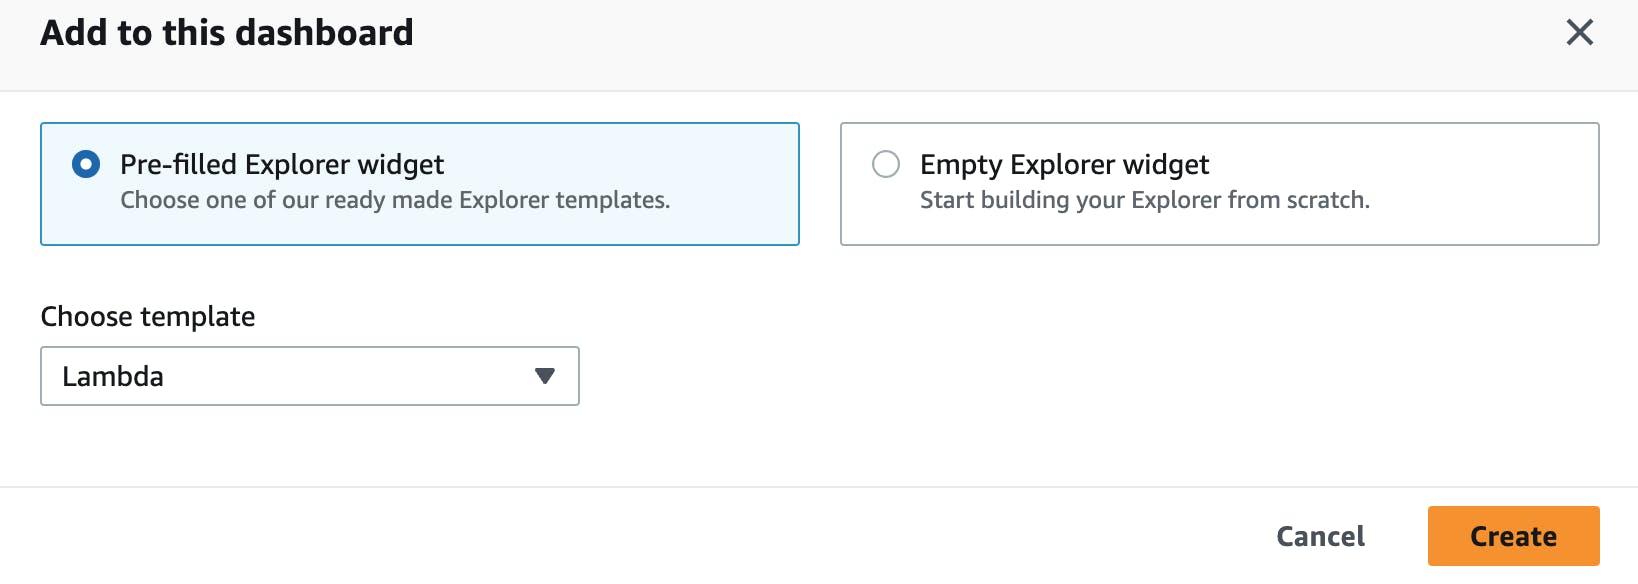
This will create an explorer overview with some typical metrics (similar to CloudWatch Automatic Dashboards). This, again, will help you to get started faster.
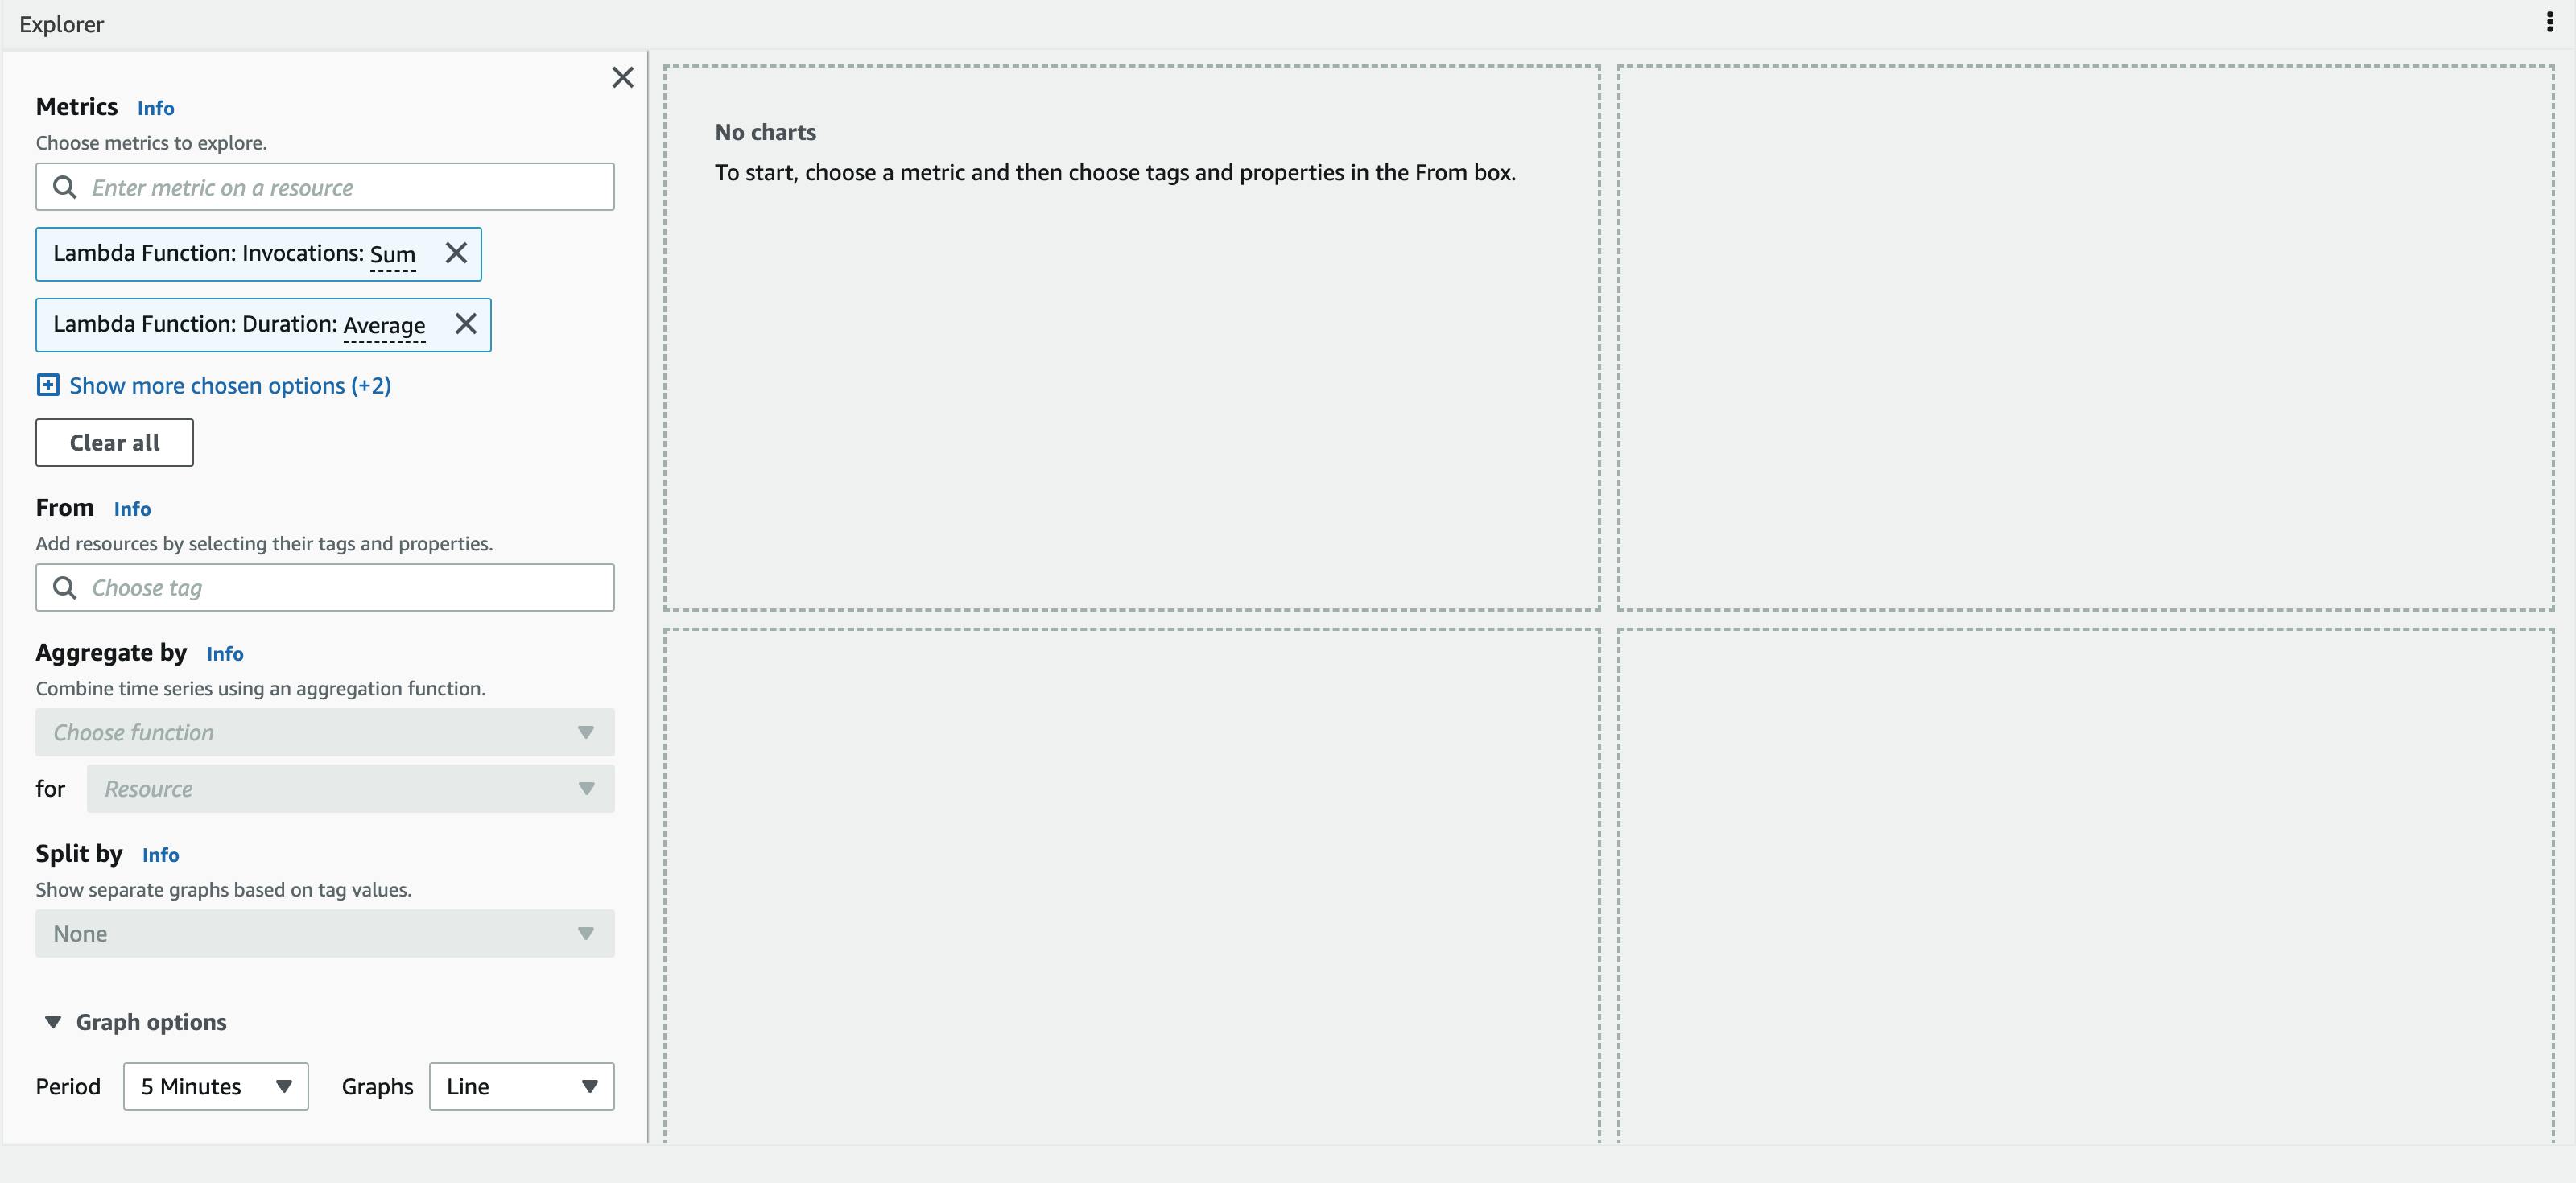
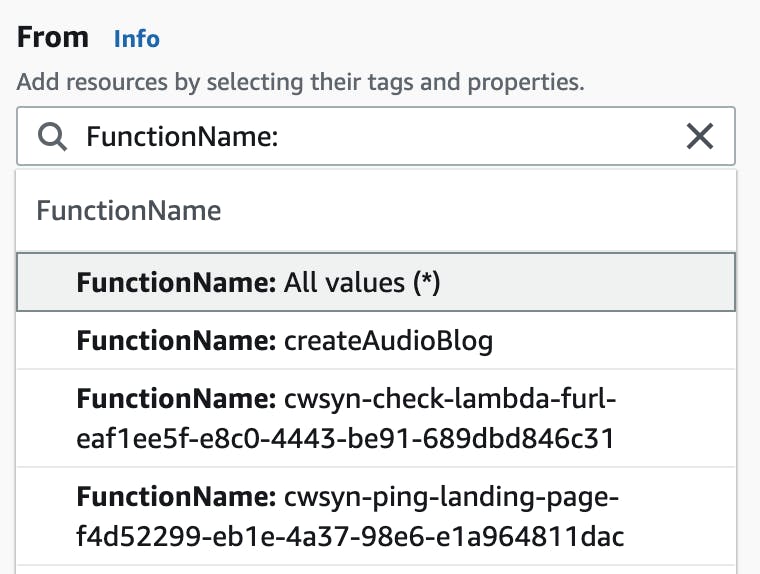
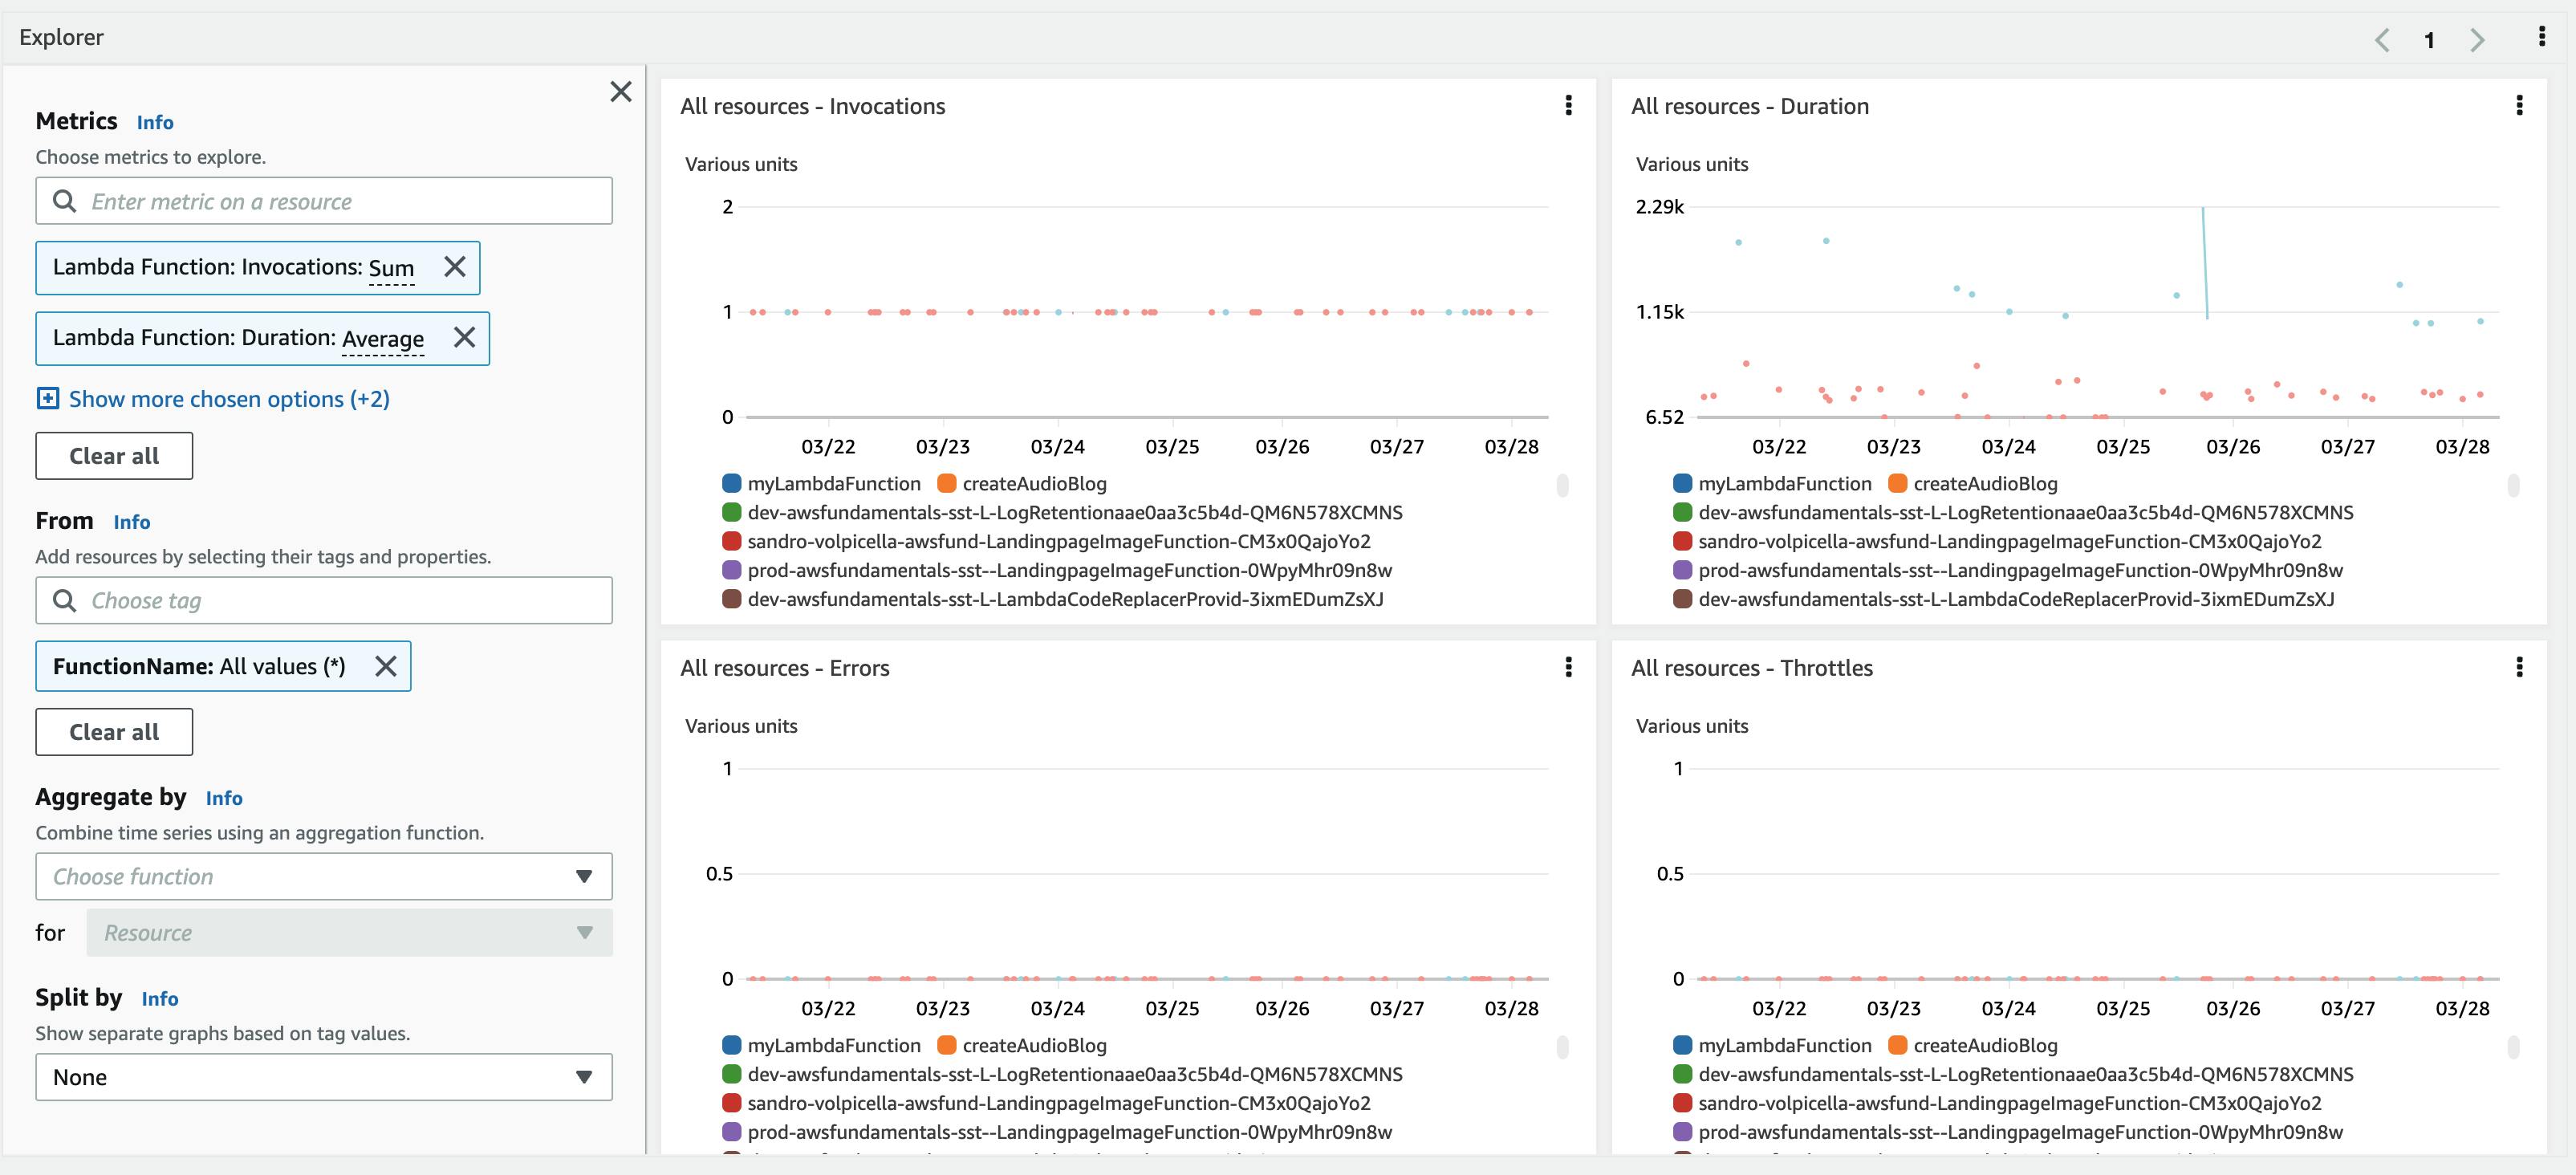
We now have to choose which Lambdas to monitor in this dashboard. Since I'm interested in all Lambdas I choose all function names.
After selecting that I can see 4 different metrics:
Invocations
Duration
Errors
Throttles
You can customize these on the explorer page in Metrics.
I'm happy with that so I'll hit Save.
Logs Table
I'm also interested in seeing some Logs, so I'll add a new widget of the type Logs Table. If you click on this widget you will be redirected to Logs Insights.
I am interested in seeing the most expensive queries of my Lambda function that adds subscribers to my newsletters. So, I'll add this query:
filter @type = "REPORT"
| fields @requestId, @billedDuration
| sort by @billedDuration desc
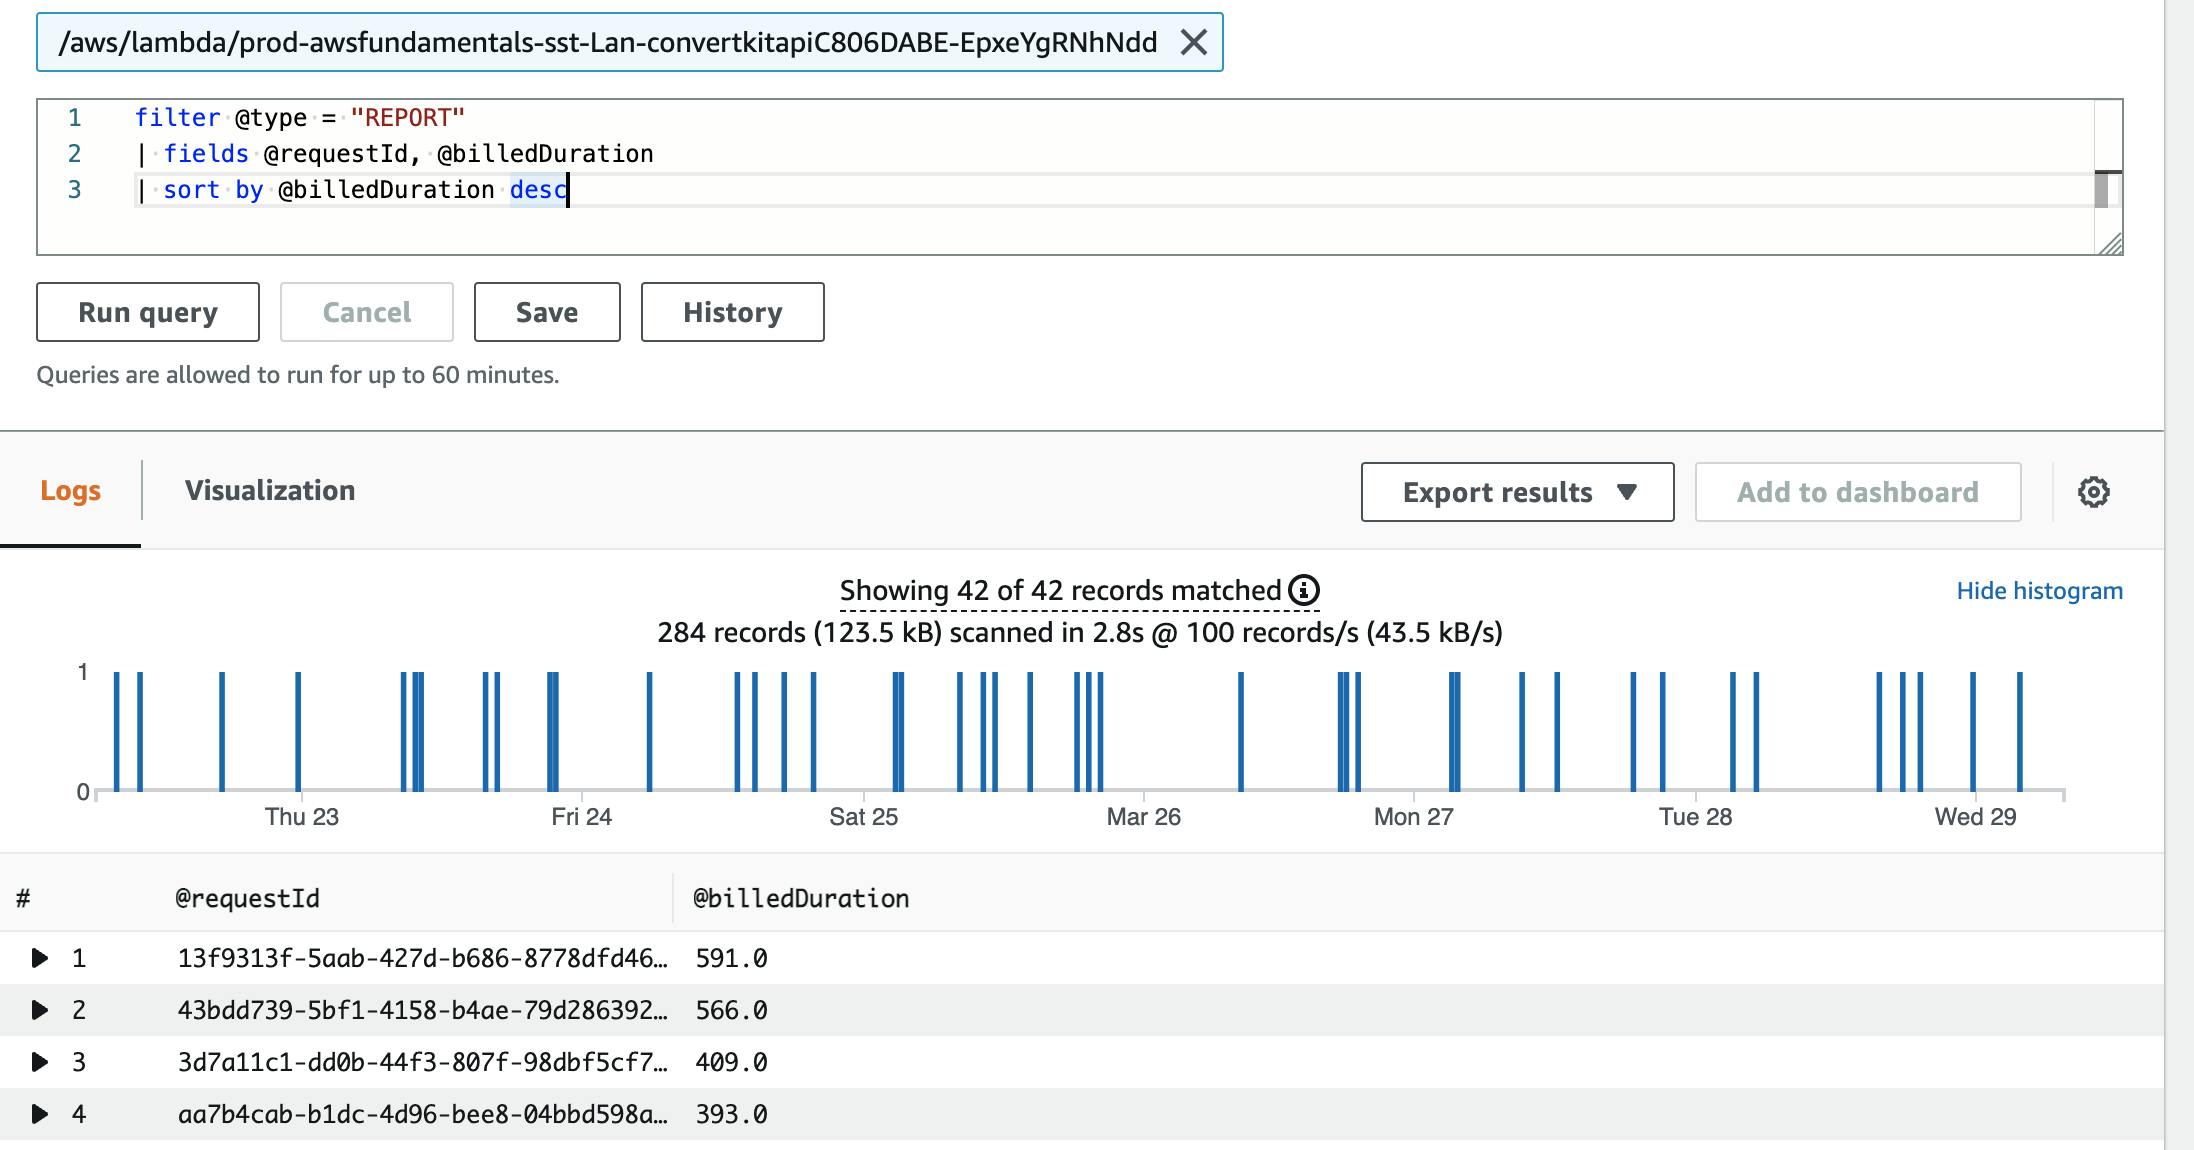
If I'm happy with the result of the query I click on Create Widget in the top bar.
Text Explanations
Now, that I'm having a good overview I'll add some text in between to explain what people can actually see here. This is even more important if you share your dashboard with colleagues who are on-call and who are not working with AWS on a daily basis.
Click on the plus for adding a new dashboard and select the Text widget.
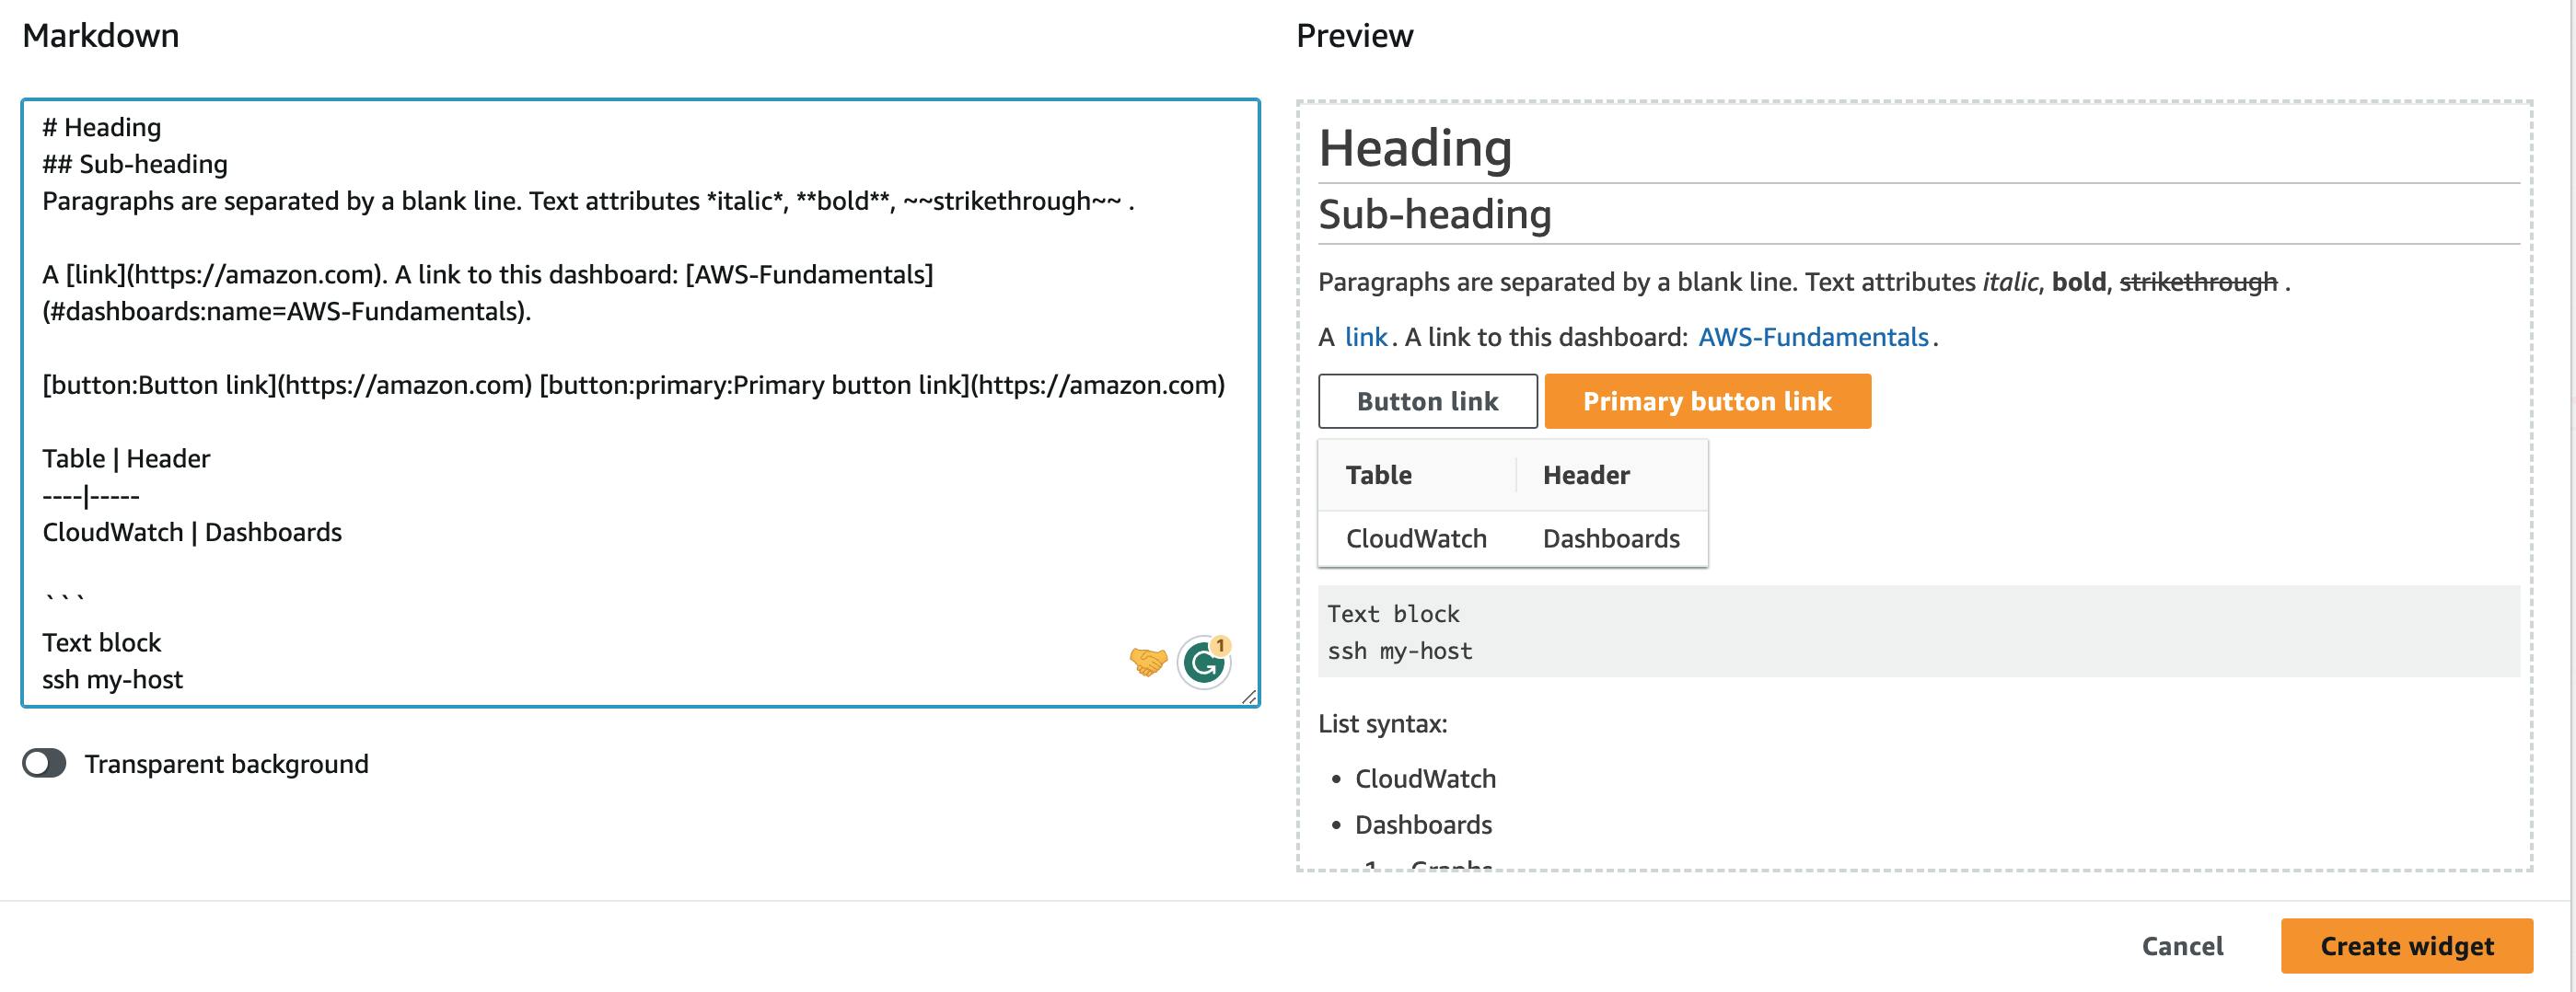
You can use Markdown for creating your text. Click on Create Widget, place your Widget wherever you want to have it (e.g. at the beginning), and click on Save.
Sharing Dashboards
You can share the dashboard with other stakeholders. You have three or even four options for sharing it:
IAM Permissions in the same account or cross-account
IAM users can access the dashboard if they have sufficient IAM permissions. Check the IAM permissions here.
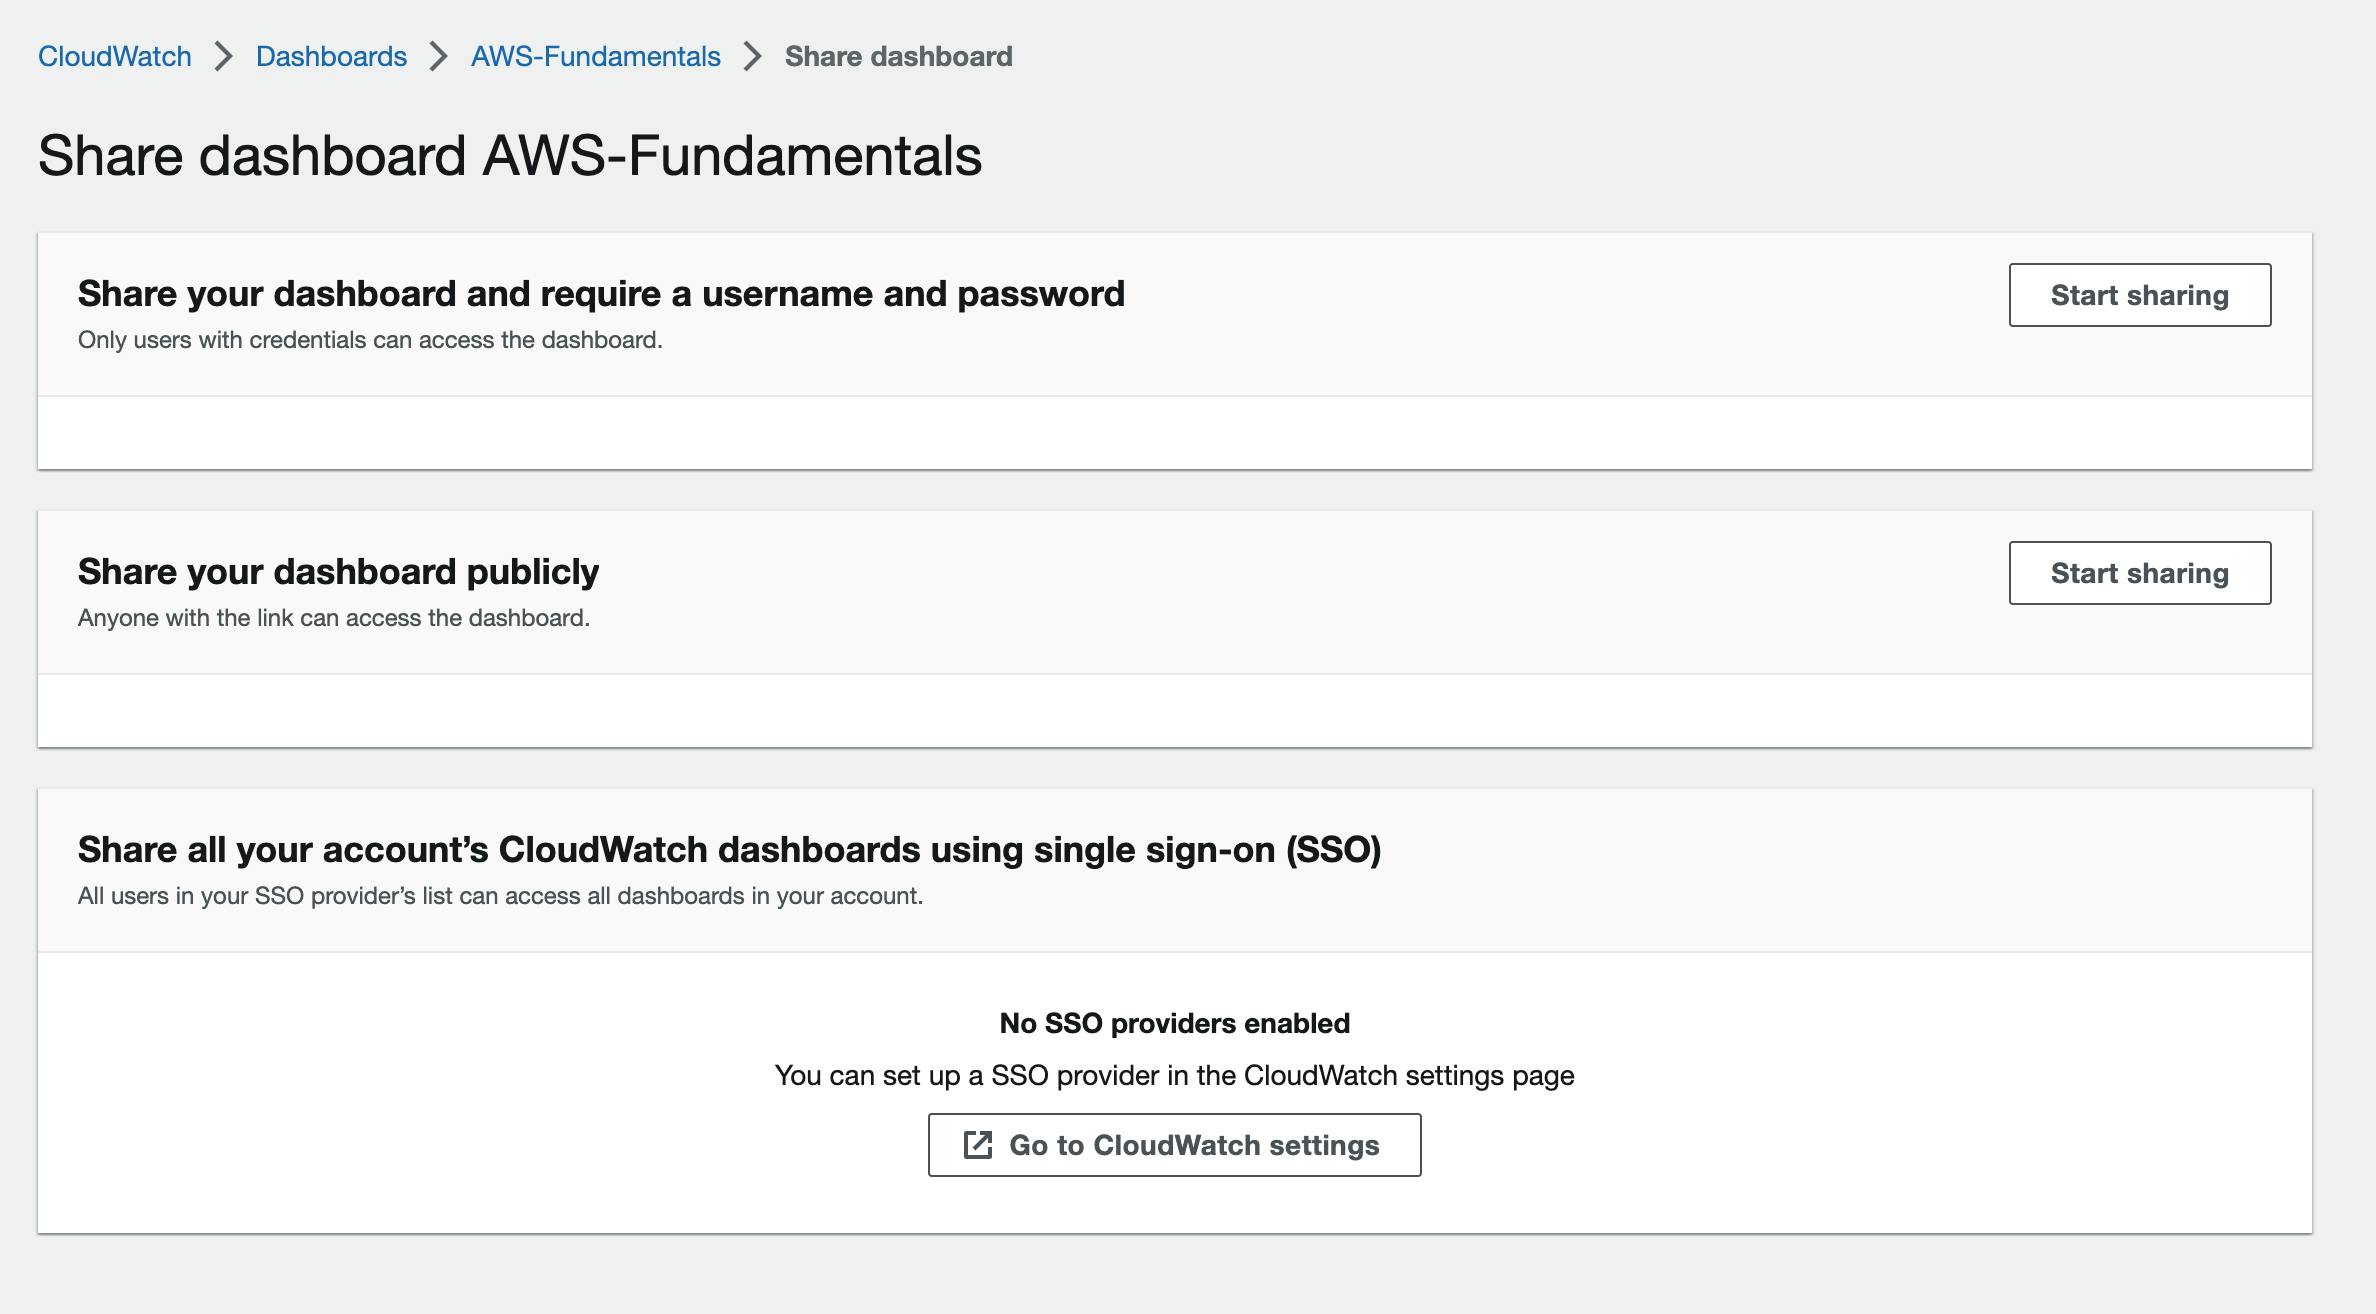
Share with a username and password
One of the great features of Dashboards is the ability to secure them with usernames and passwords. To achieve this, simply navigate to your dashboard, select the option to Share Dashboard, and specify a username and password for access to your dashboard.
Next, you'll need to include the email addresses of the individuals with whom you wish to share the dashboard, granting them access.
Share your dashboard publicly
The third way to share your dashboard is by making it public. Anyone with the link can then view it. Just make sure you're aware of what you're sharing!
Share it with AWS Identity Center
AWS Identity Center, former AWS SSO, can also be used to share your dashboards. If you have Identity Center and SSO providers enabled you can share it with respected users or groups.
Pricing
Amazon CloudWatch Dashboards' pricing is dependent on several factors, such as the number of dashboards you create, the number of metrics you request, and the frequency of metric updates. It's essential to understand the costs involved to manage your resources and budget effectively. In this chapter, we'll break down the pricing components for CloudWatch Dashboards.
Free Tier
The CloudWatch Dashboard free tier includes 3 dashboards for up to 50 metrics per month.
Dashboard Pricing
CloudWatch Dashboards are billed based on the number of dashboards you create and maintain. Each dashboard costs $3 per month.
It's important to note that the cost mentioned above only includes the dashboards themselves. The actual CloudWatch usage, such as data ingestion, storage, and retrieval, will incur additional charges.
Conclusion
Amazon CloudWatch Dashboards provide a powerful and customizable solution for monitoring and visualizing your AWS resources' performance and health. By harnessing the flexibility of manual dashboards and the convenience of automatic dashboards, you can create comprehensive overviews of your system's Logs, Metrics, and Alarms. Sharing these dashboards with stakeholders and teams is streamlined through various options, including IAM permissions, username/password protection, public access, and AWS Identity Center.
In conclusion, CloudWatch Dashboards serve as an invaluable tool for AWS users who want to maintain a clear and efficient overview of their application's health, allowing for quicker identification of issues and more informed decision-making.
FAQ
1. What is Amazon CloudWatch?
Amazon CloudWatch is a monitoring and observability service that provides you with data and actionable insights to monitor your applications, respond to system-wide performance changes, optimize resource utilization, and gain a unified view of operational health. It collects logs and metrics from various AWS services, which can be visualized through CloudWatch Dashboards.
2. What is a CloudWatch Dashboard?
A CloudWatch Dashboard is a customizable web-based interface that provides an overview of various metrics, logs, and alarms within your AWS infrastructure. Dashboards can include automatic or manual widgets, which display specific data points, charts, or tables for your AWS services. You can share dashboards with team members and stakeholders, allowing everyone to stay informed on your system's performance and health.
3. What is the difference between Automatic and Manual Dashboards?
Automatic Dashboards are pre-configured by AWS and provide an overview of common metrics for specific AWS services, such as Lambda, S3, and CloudFront. Manual Dashboards, on the other hand, allow you to create custom dashboards tailored to your specific monitoring needs, combining metrics and logs from various AWS services. Manual Dashboards provide greater flexibility and customization, enabling you to create a comprehensive view of your application's performance.
4. How can I share my CloudWatch Dashboard with team members and stakeholders?
You can share CloudWatch Dashboards through several options, including IAM permissions (in the same or cross-account), username/password protection, public access with a sharable link, or through AWS Identity Center. Choose the method that best suits your security requirements and the level of access needed by your team members and stakeholders.
5. How is the pricing for CloudWatch Dashboards determined?
CloudWatch Dashboards' pricing depends on the number of created dashboards. Each dashboard incurs a monthly cost, and metrics, data points, and alarms are billed separately. Additionally, other CloudWatch services, like CloudWatch Logs and CloudWatch Events, have their own pricing structures.