


Understanding CloudWatch: A Comprehensive Guide to AWS Monitoring Service


AWS CloudWatch is one of the basic services within AWS. It doesn't matter which type of application you are working on, you need to master CloudWatch. CloudWatch provides real-time data and actionable insights to improve the performance and availability of your applications.
You won't use AWS without understanding CloudWatch. So, let's dive deep into it.
Introduction to CloudWatch
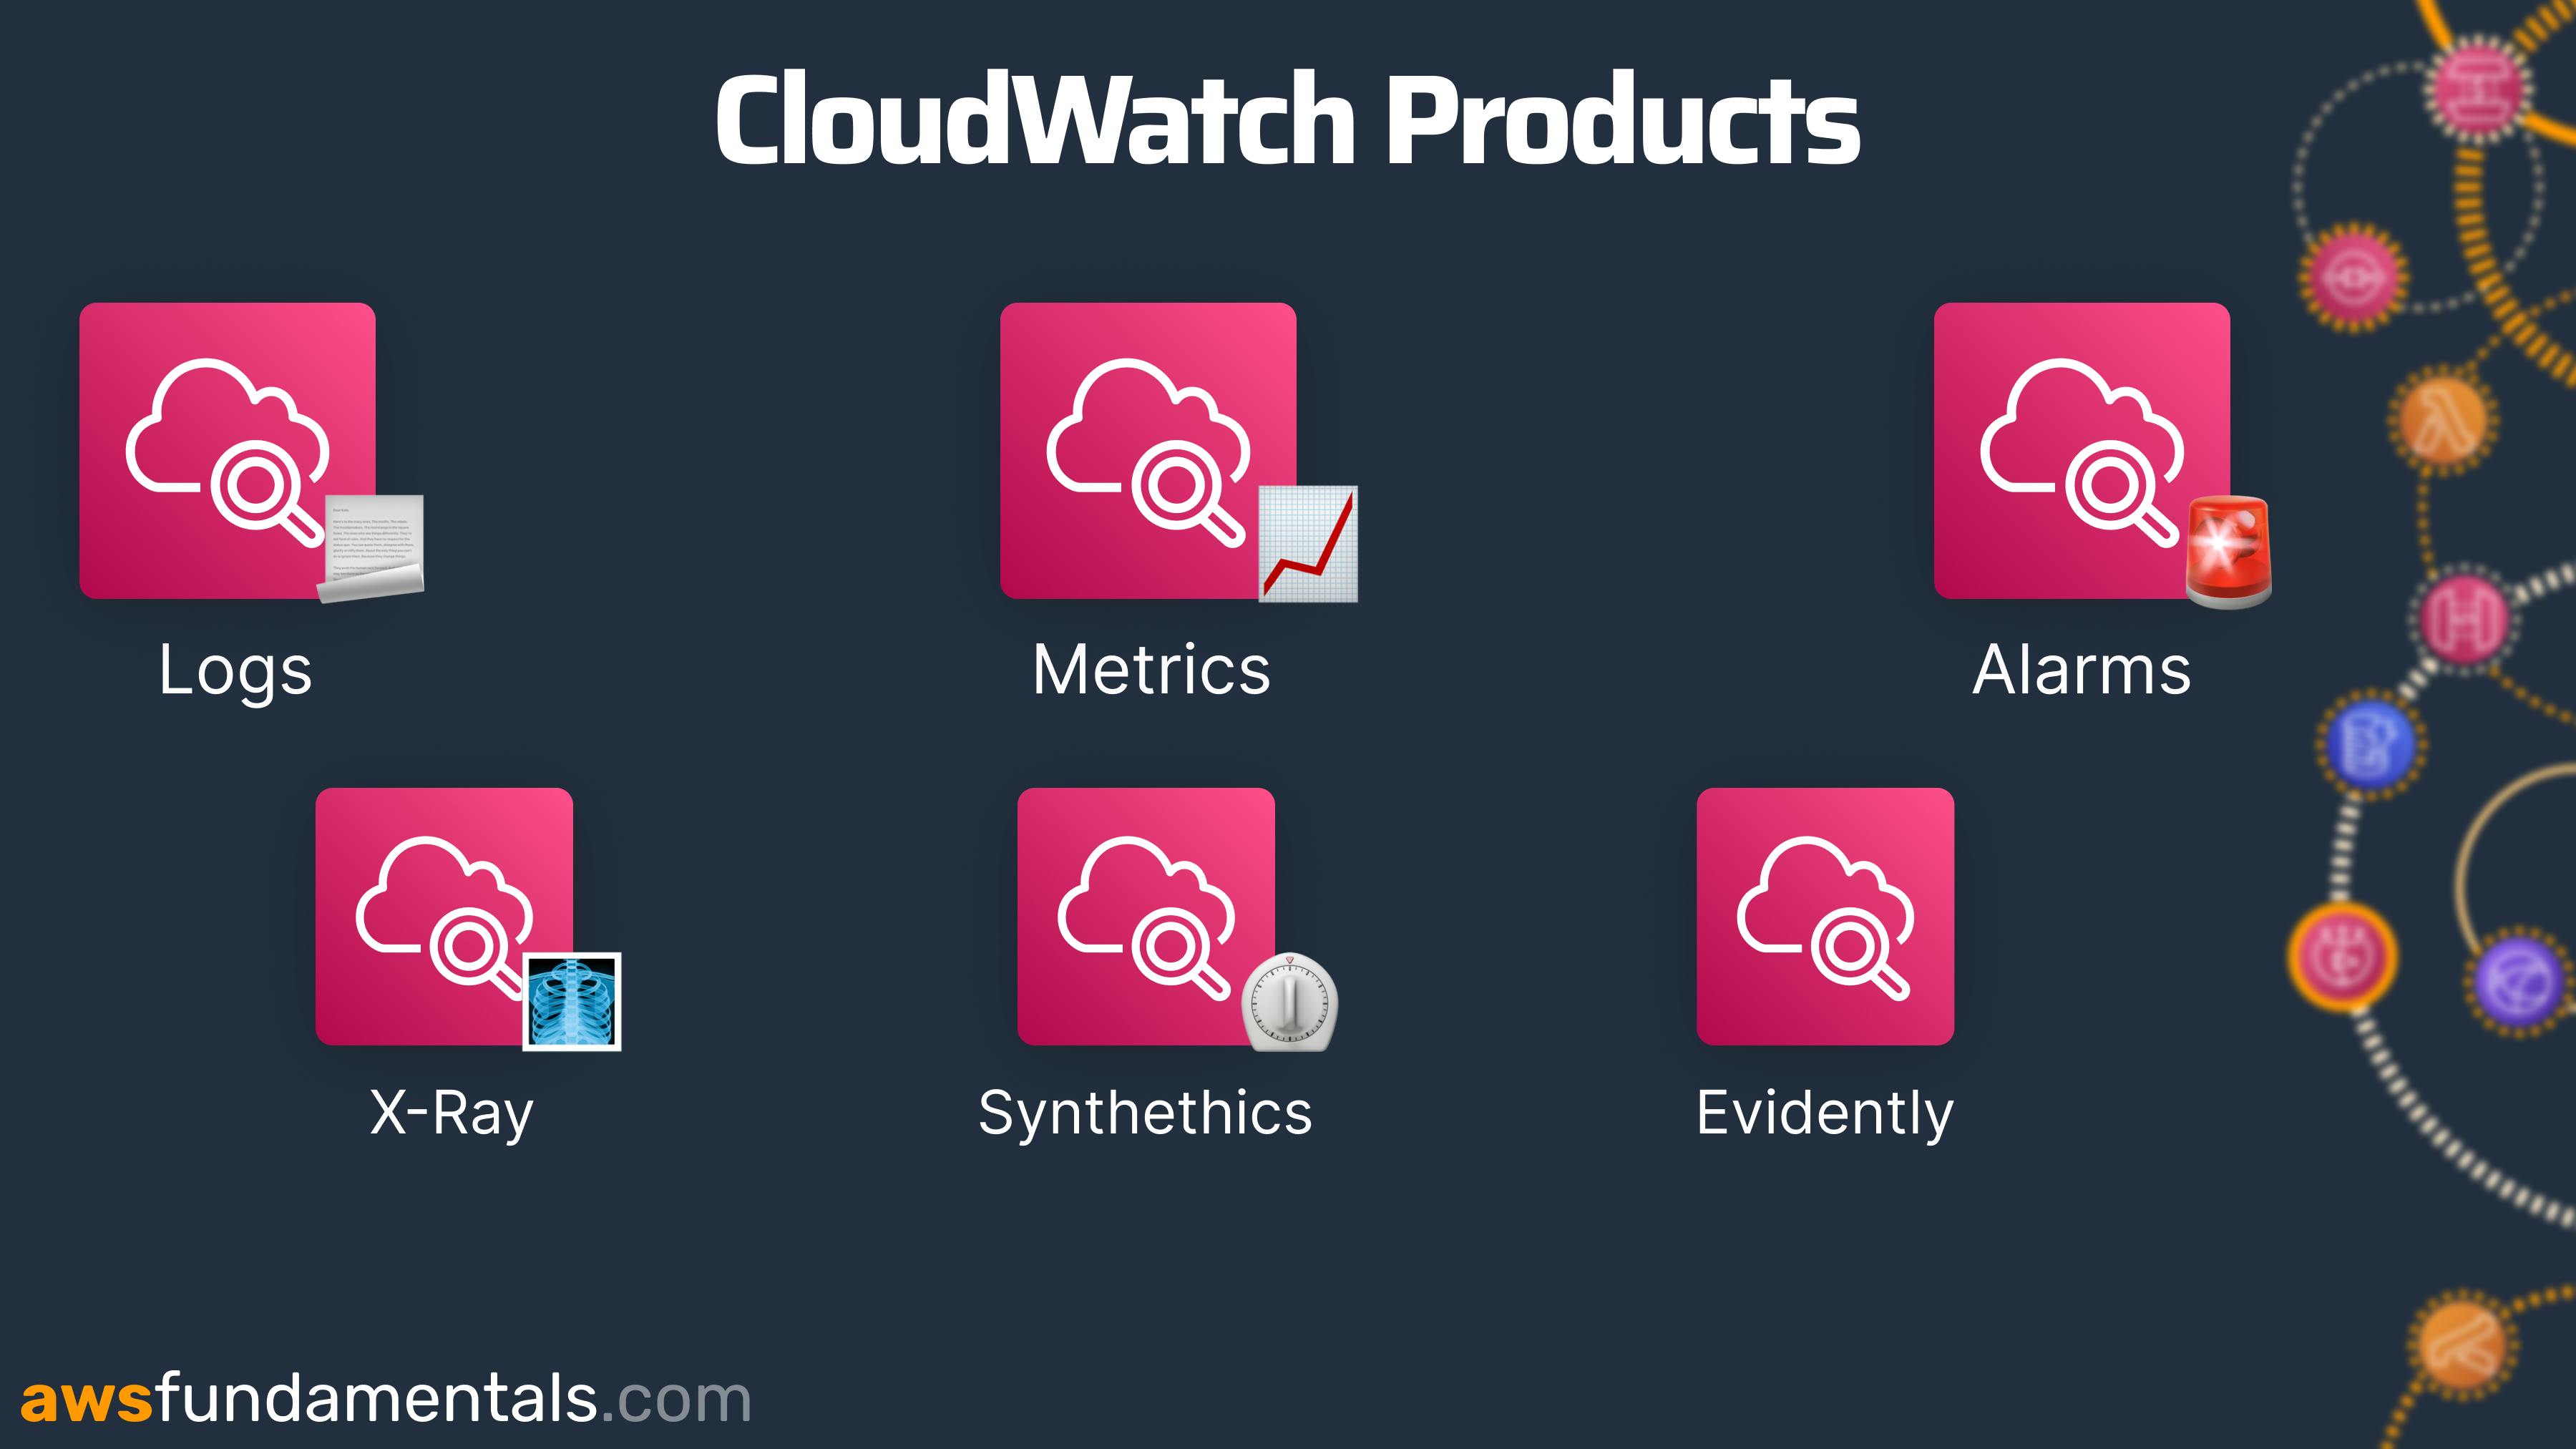
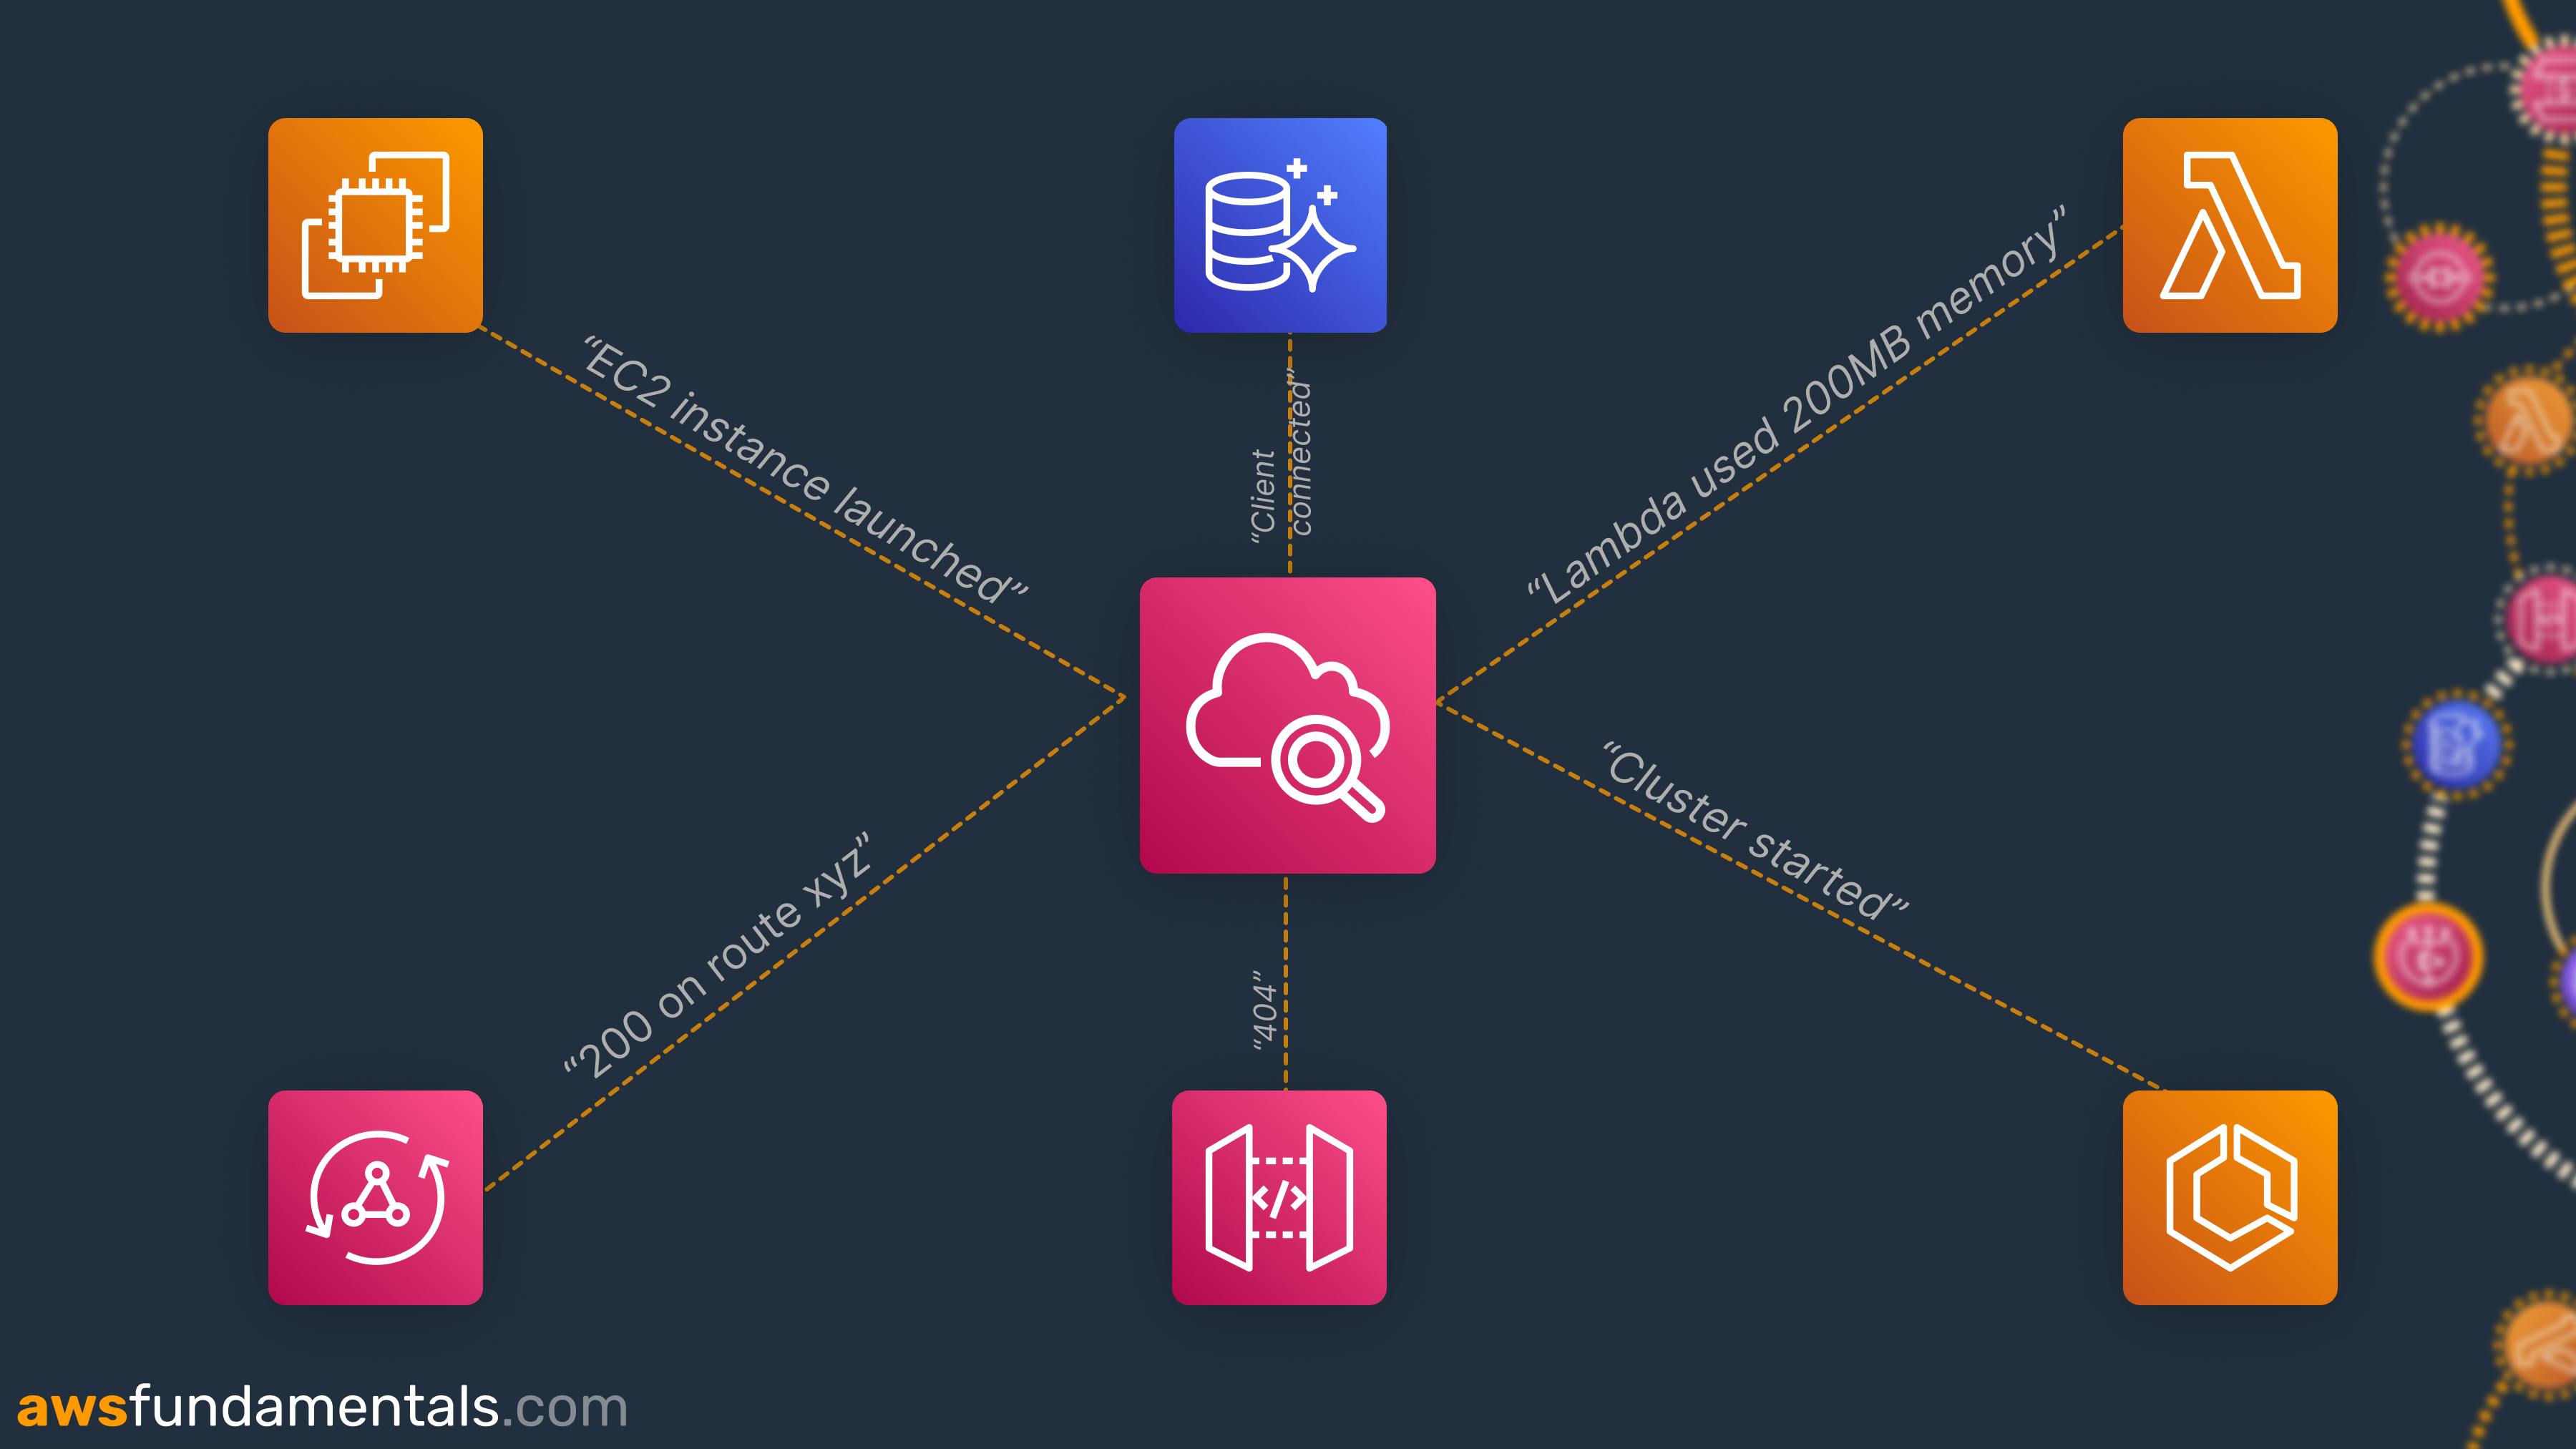
Amazon CloudWatch is AWS’s central logging and metrics service. Each AWS service logs to CloudWatch. But CloudWatch offers even more. The following table gives you an overview of all the services that CloudWatch has to offer, which we will cover in this article:
| Name | Explanation |
| Logs | The central logging place. Each service logs to CloudWatch. You can also add agents to your custom services to log into CloudWatch. |
| Metrics | Each service collects metrics. For example, AWS Lambda collects the number of innovations, errors, and timeouts. These can be really helpful for understanding how your system behaves. |
| Alarms | Alarms notify you in case of outages or problems. Alarms are based on metrics. |
| X-Ray | X-Ray helps you trace requests across your different services. |
| Synthetics | Synthetics are custom scripts or browser-based scripts that check your application's health regularly. |
| Evidently | Evidently allows you to try out different configurations for different customers. |
Most CloudWatch products interact with each other. For example, you can collect Logs with CloudWatch Logs. Metrics can either be derived from the logs or are created automatically from all supported services. CloudWatch Alarms can trigger alarms in case of abnormal behavior like a large number of Lamdba Errors. Alarms can send you automated emails or even call you.
CloudWatch is one of the most underrated services to learn. There is no scenario where you use AWS without using CloudWatch. Even if you use external tools like Datadog or Lumigo you should understand how CloudWatch collects your Logs & Metrics.
Benefits of CloudWatch
Some benefits of CloudWatch are:
Central logging space: With CloudWatch you have one space where all services log to. This makes debugging so much easier. Cloud systems often consist of several services. Understanding just one user request can already be challenging. CloudWatch makes this much easier.
Alarms - Reduced Downtime: With CloudWatch alarms you can get notified in real-time if your system behaves abnormally. This can reduce your downtime a lot. You can act before your customers experience any downtime.
AWS-Native Tools: AWS offers you an amazing suite of monitoring tools for your resources. You can save a lot of money by understanding and using these tools instead of relying on third-party tools.
Comparison to other Monitoring Services
CloudTrail vs. CloudWatch
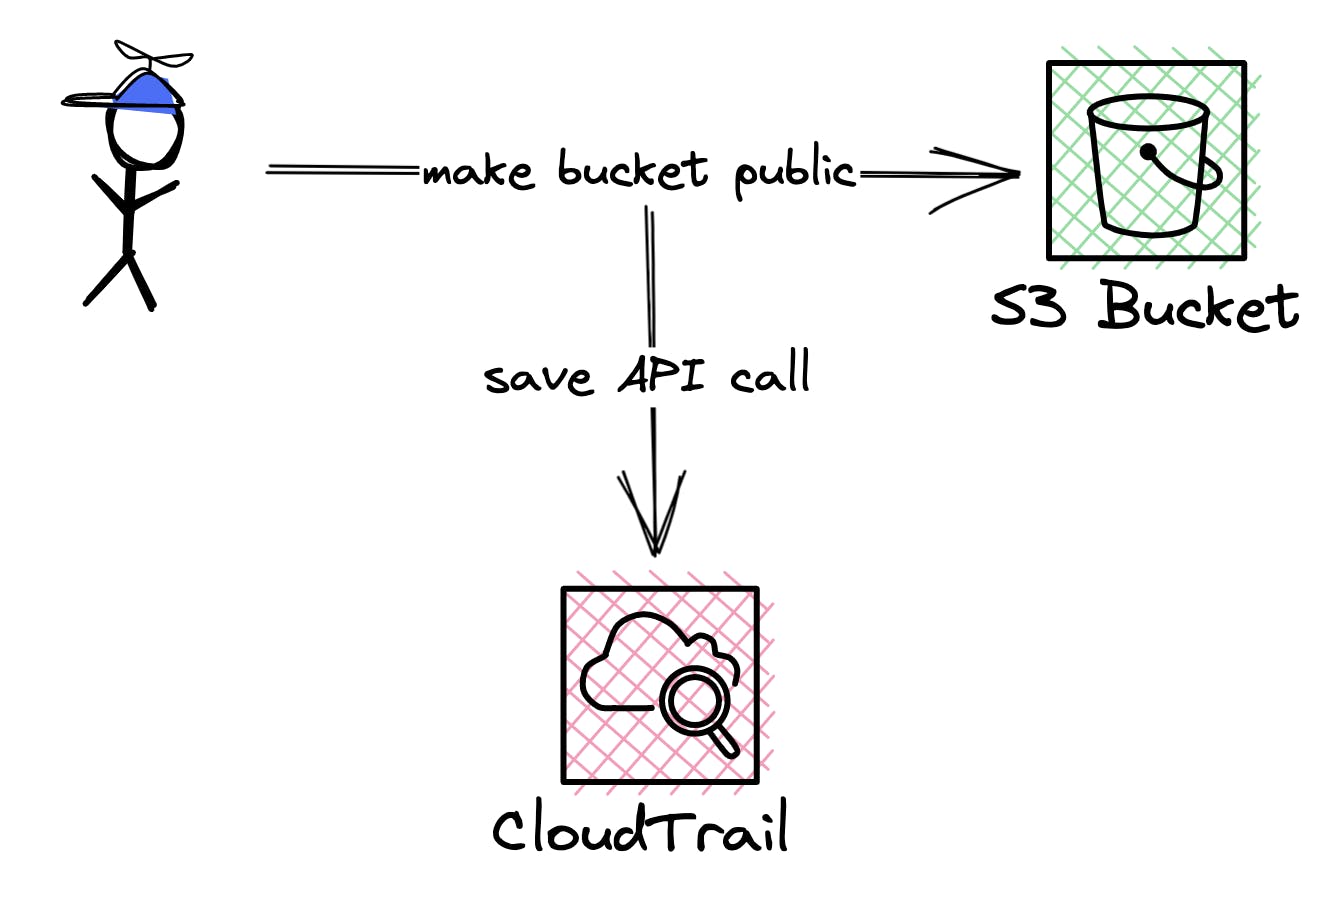
CloudWatch and CloudTrail are often confused with each other. They are completely different services. CloudWatch is monitoring your applications and services. While CloudTrail is monitoring your internal API Access.
Let's see an example.
CloudWatch:
How many errors do I have in my lambda function?
How long does my API take to return?
CloudTrail:
Who changed the bucket policy to public?
Who created a new admin user?
Let's see each CloudWatch feature by itself with some examples from an actual AWS application.
CloudWatch Logs - Centralized Place for all Logs
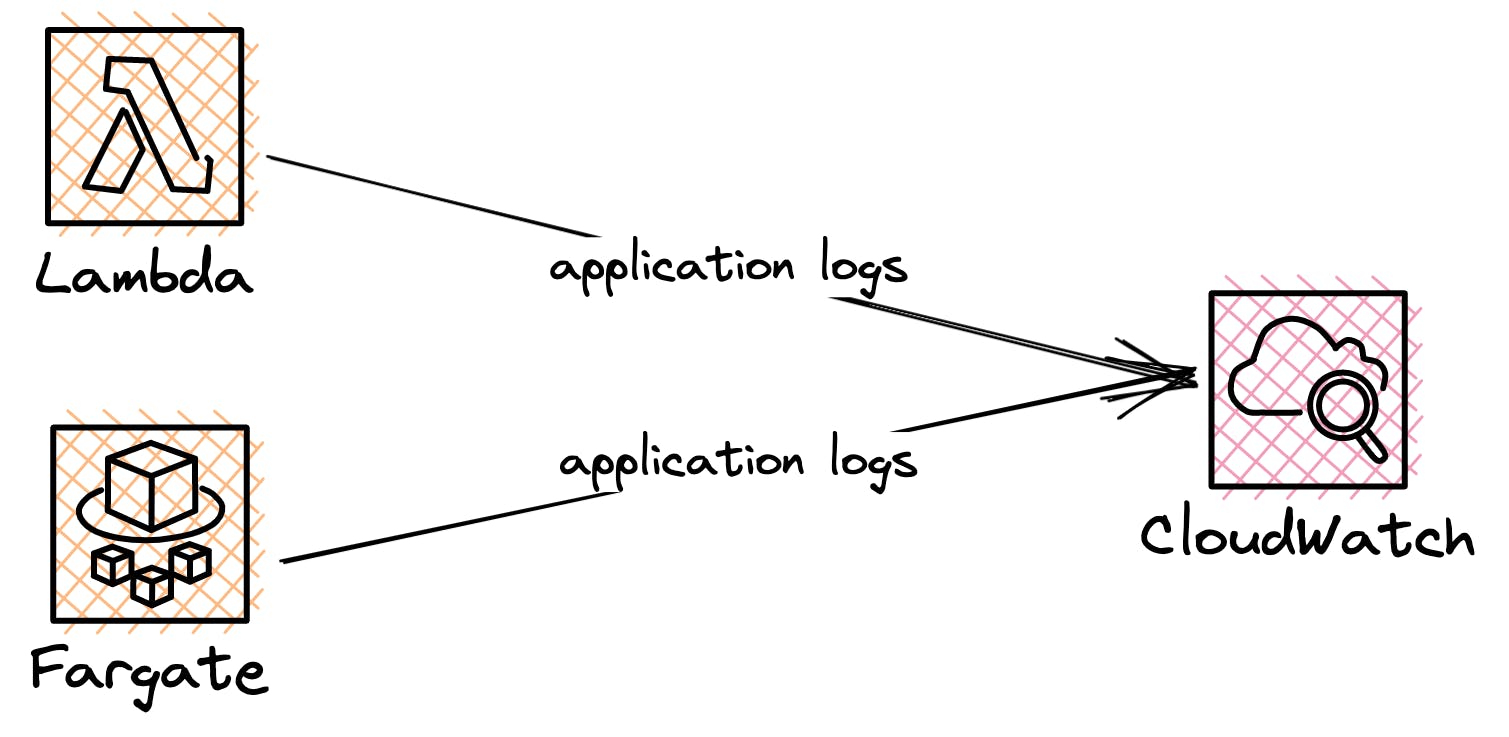
One of the main products within CloudWatch is CloudWatch Logs. CloudWatch Logs is the centralized logging space within AWS. Every AWS Service natively logs to CloudWatch Logs.
What is a Log?
Logs are the text output of your application. For example, if you put a print statement (console.log for Node.js) into your Lambda function and run it. You will find the log in CloudWatch.
Often you will use a dedicated logger within your application that logs more than just a message. For AWS Lambda you can make use of the amazing powertools developed by AWS. In the following example we have used a JSON logger to log an example message:
{
    "message": "This is a message",
    "awsRegion": "eu-central-1",
    "functionName": "ThumbnailLambda",
    "functionVersion": "$LATEST",
    "functionMemorySize": "512",
    "awsRequestId": "ghjkghjk-7466-497e-ac55-3d9c1d9beee0",
    "x-correlation-id": "ghjkgkhj-7466-497e-ac55-3d9c1d9beee0",
    "sLevel": "DEBUG"
}
Logging in JSON is much better because it is easier to query your logs and to add additional data like a user ID or request IDs.
CloudWatch Logs Concepts
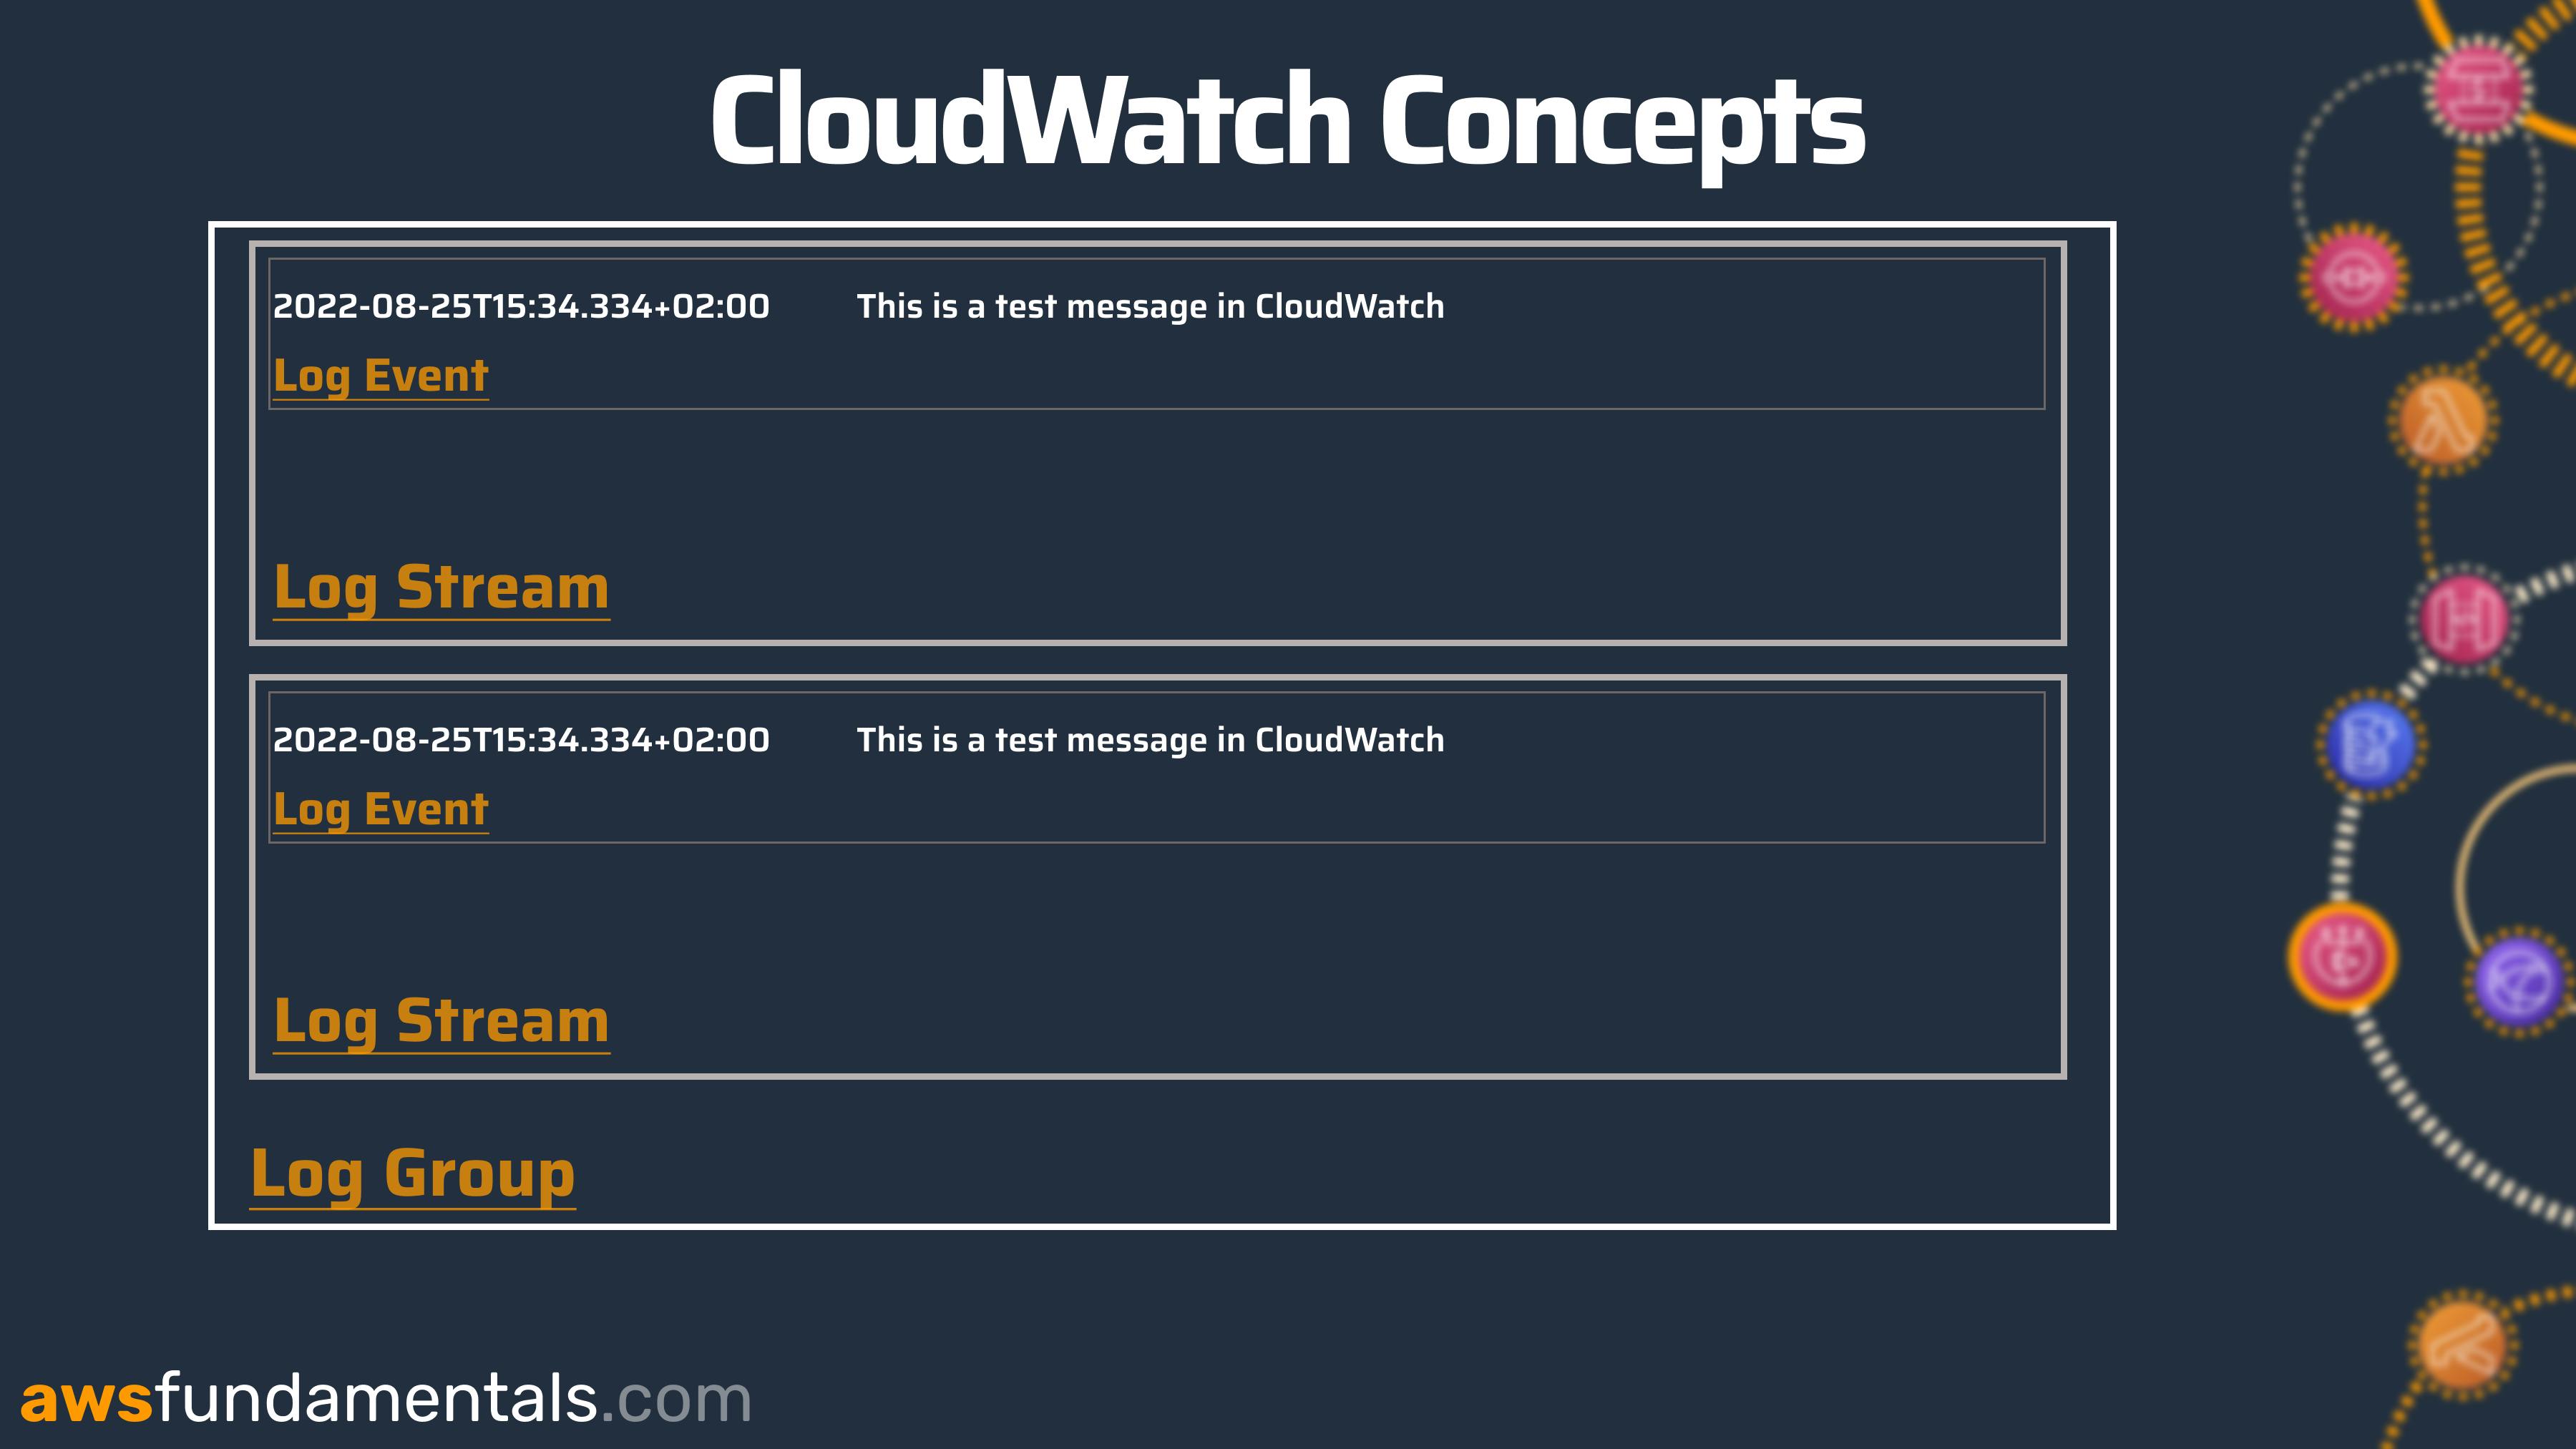
CloudWatch follows the following concepts
| Name | Explanation |
| Log Event | The actual log itself. |
| Log Stream | A stream of multiple log events. |
| Log Group | A log group is a container that holds multiple log streams. Typically, one resource (like one Lambda function) has one dedicated log group. |
Log Event - The Log Output
The Log Event is the actual log output from your application. For a Lambda function that means one invocation of your Lambda function logs a Log Event.
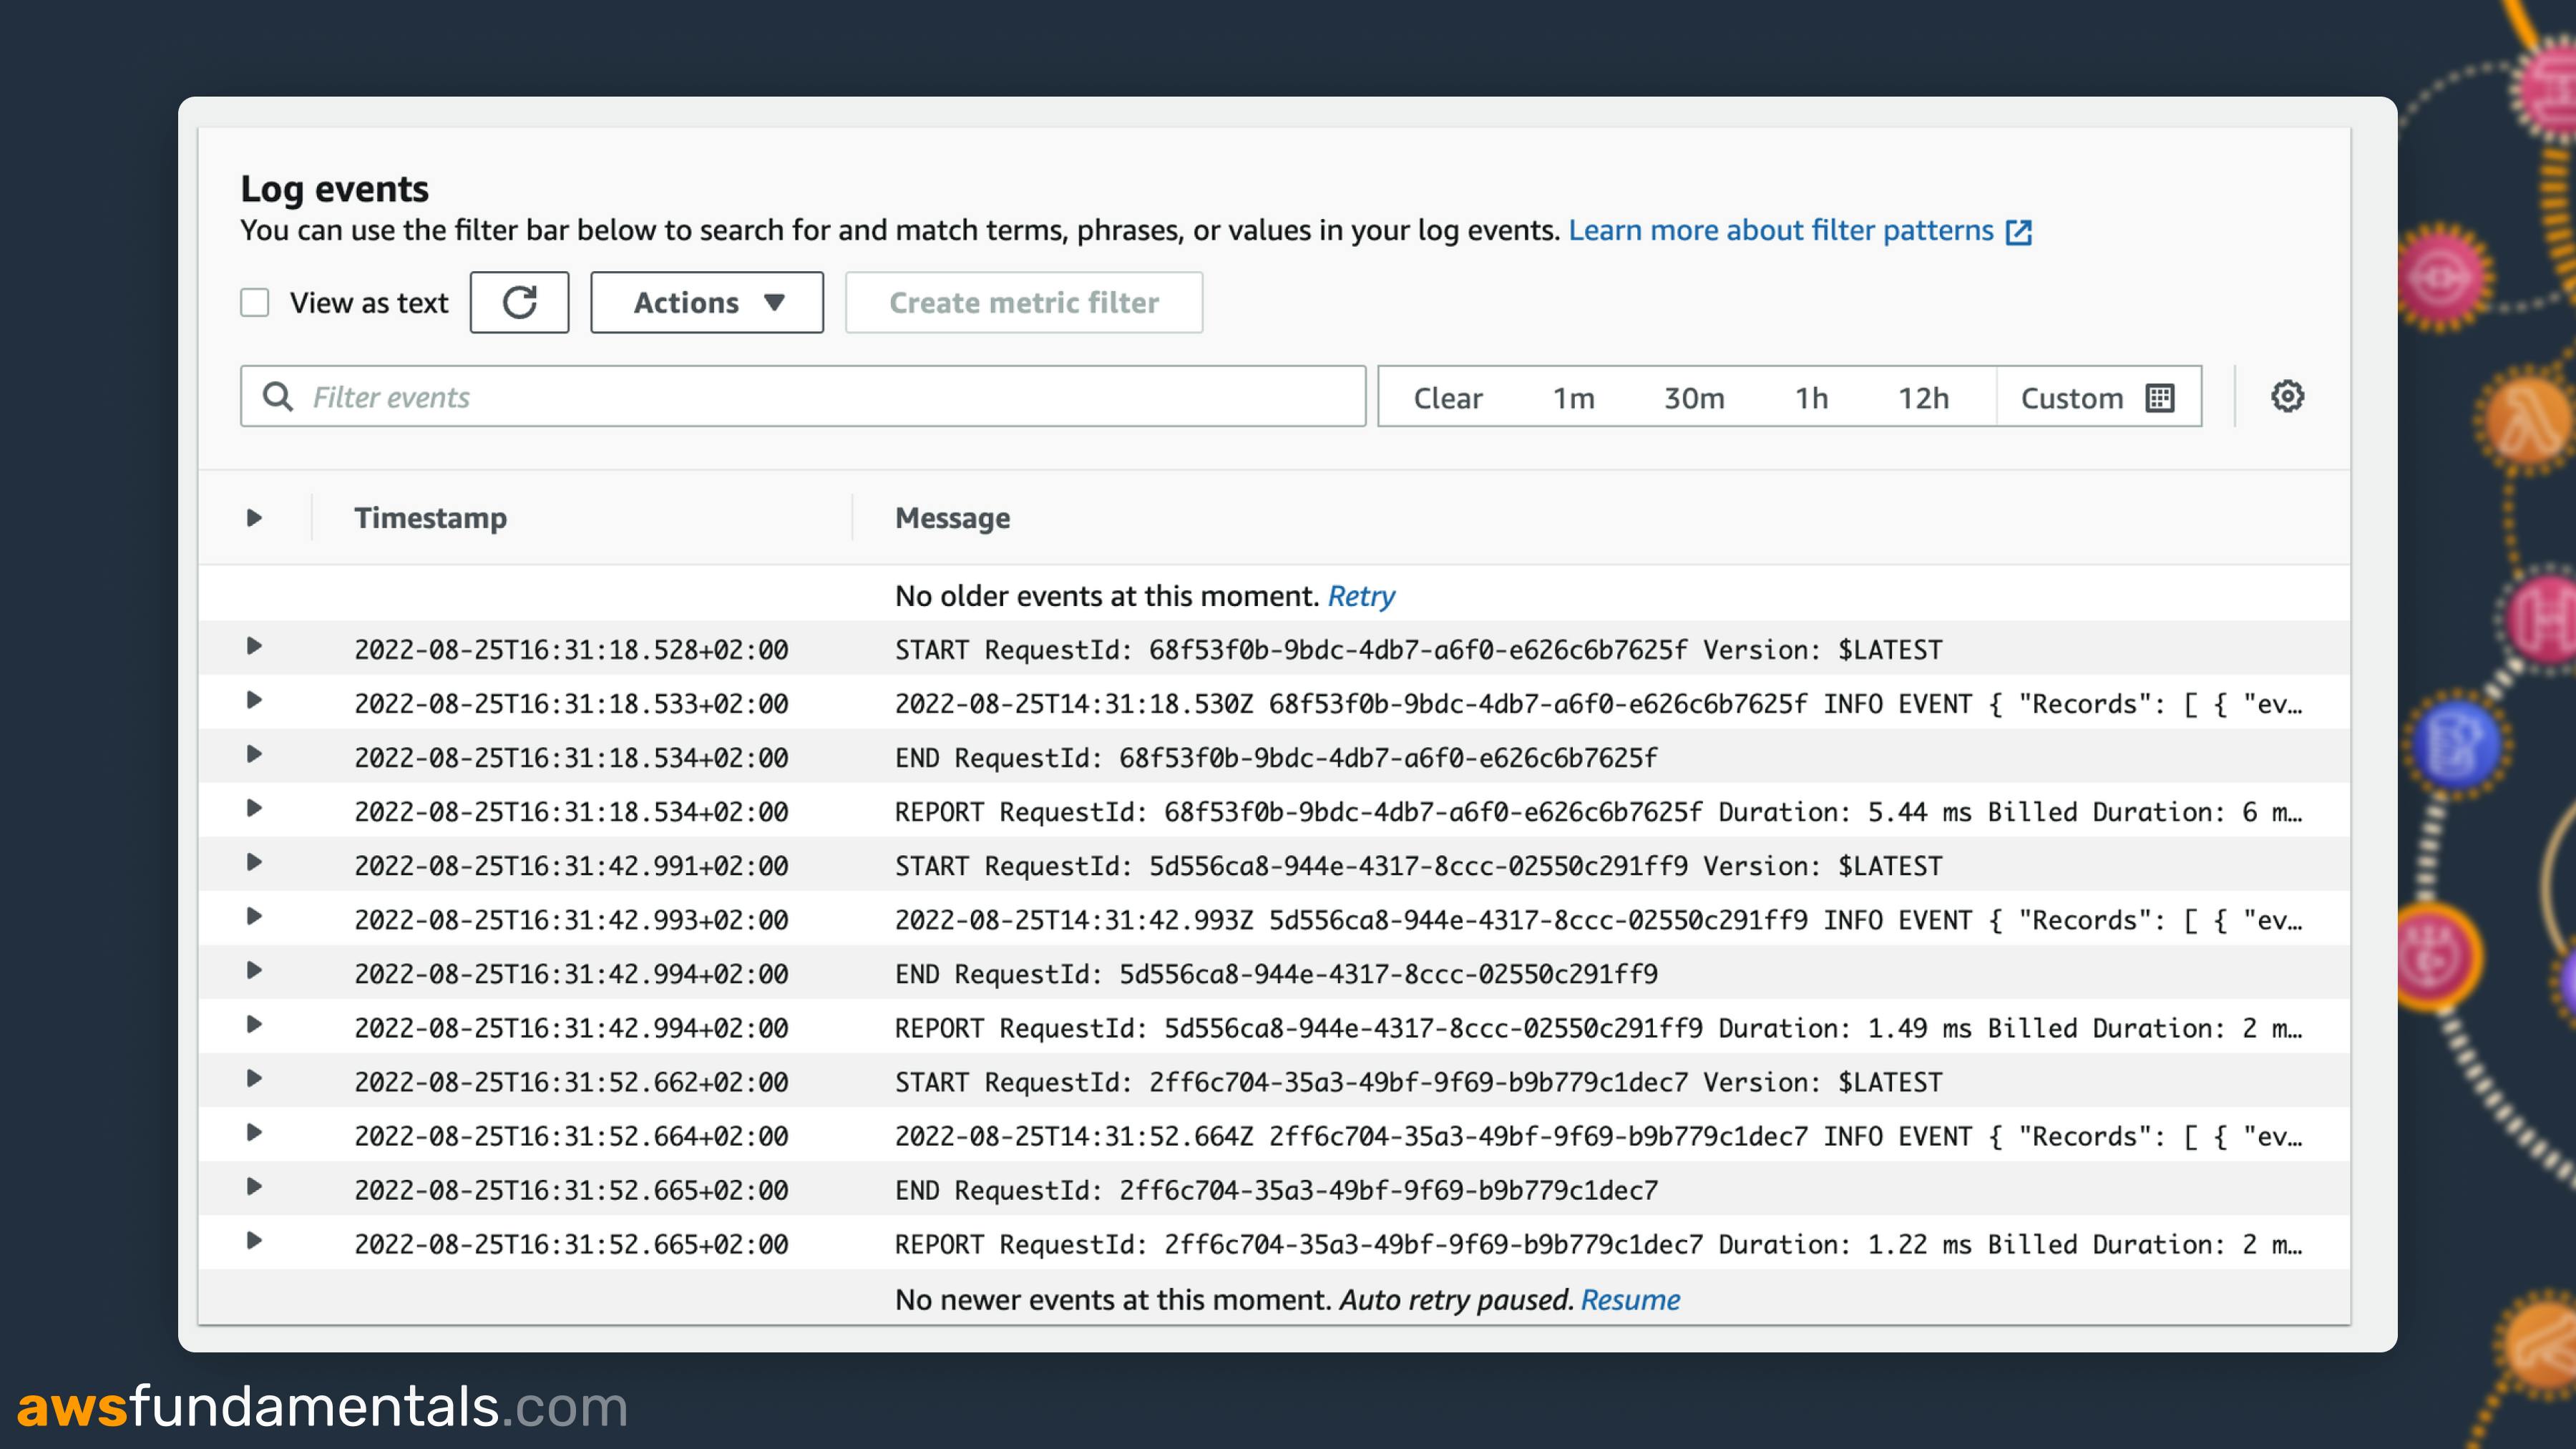
Each Log Event contains the following information:
Timestamp: The time of your log
START: An identifier when your log event starts
END: An identifier once your log event ends
RequestId: A unique request ID to this one log event
Log Streams - One or more Log Events
A Log Stream can hold multiple Log Events.
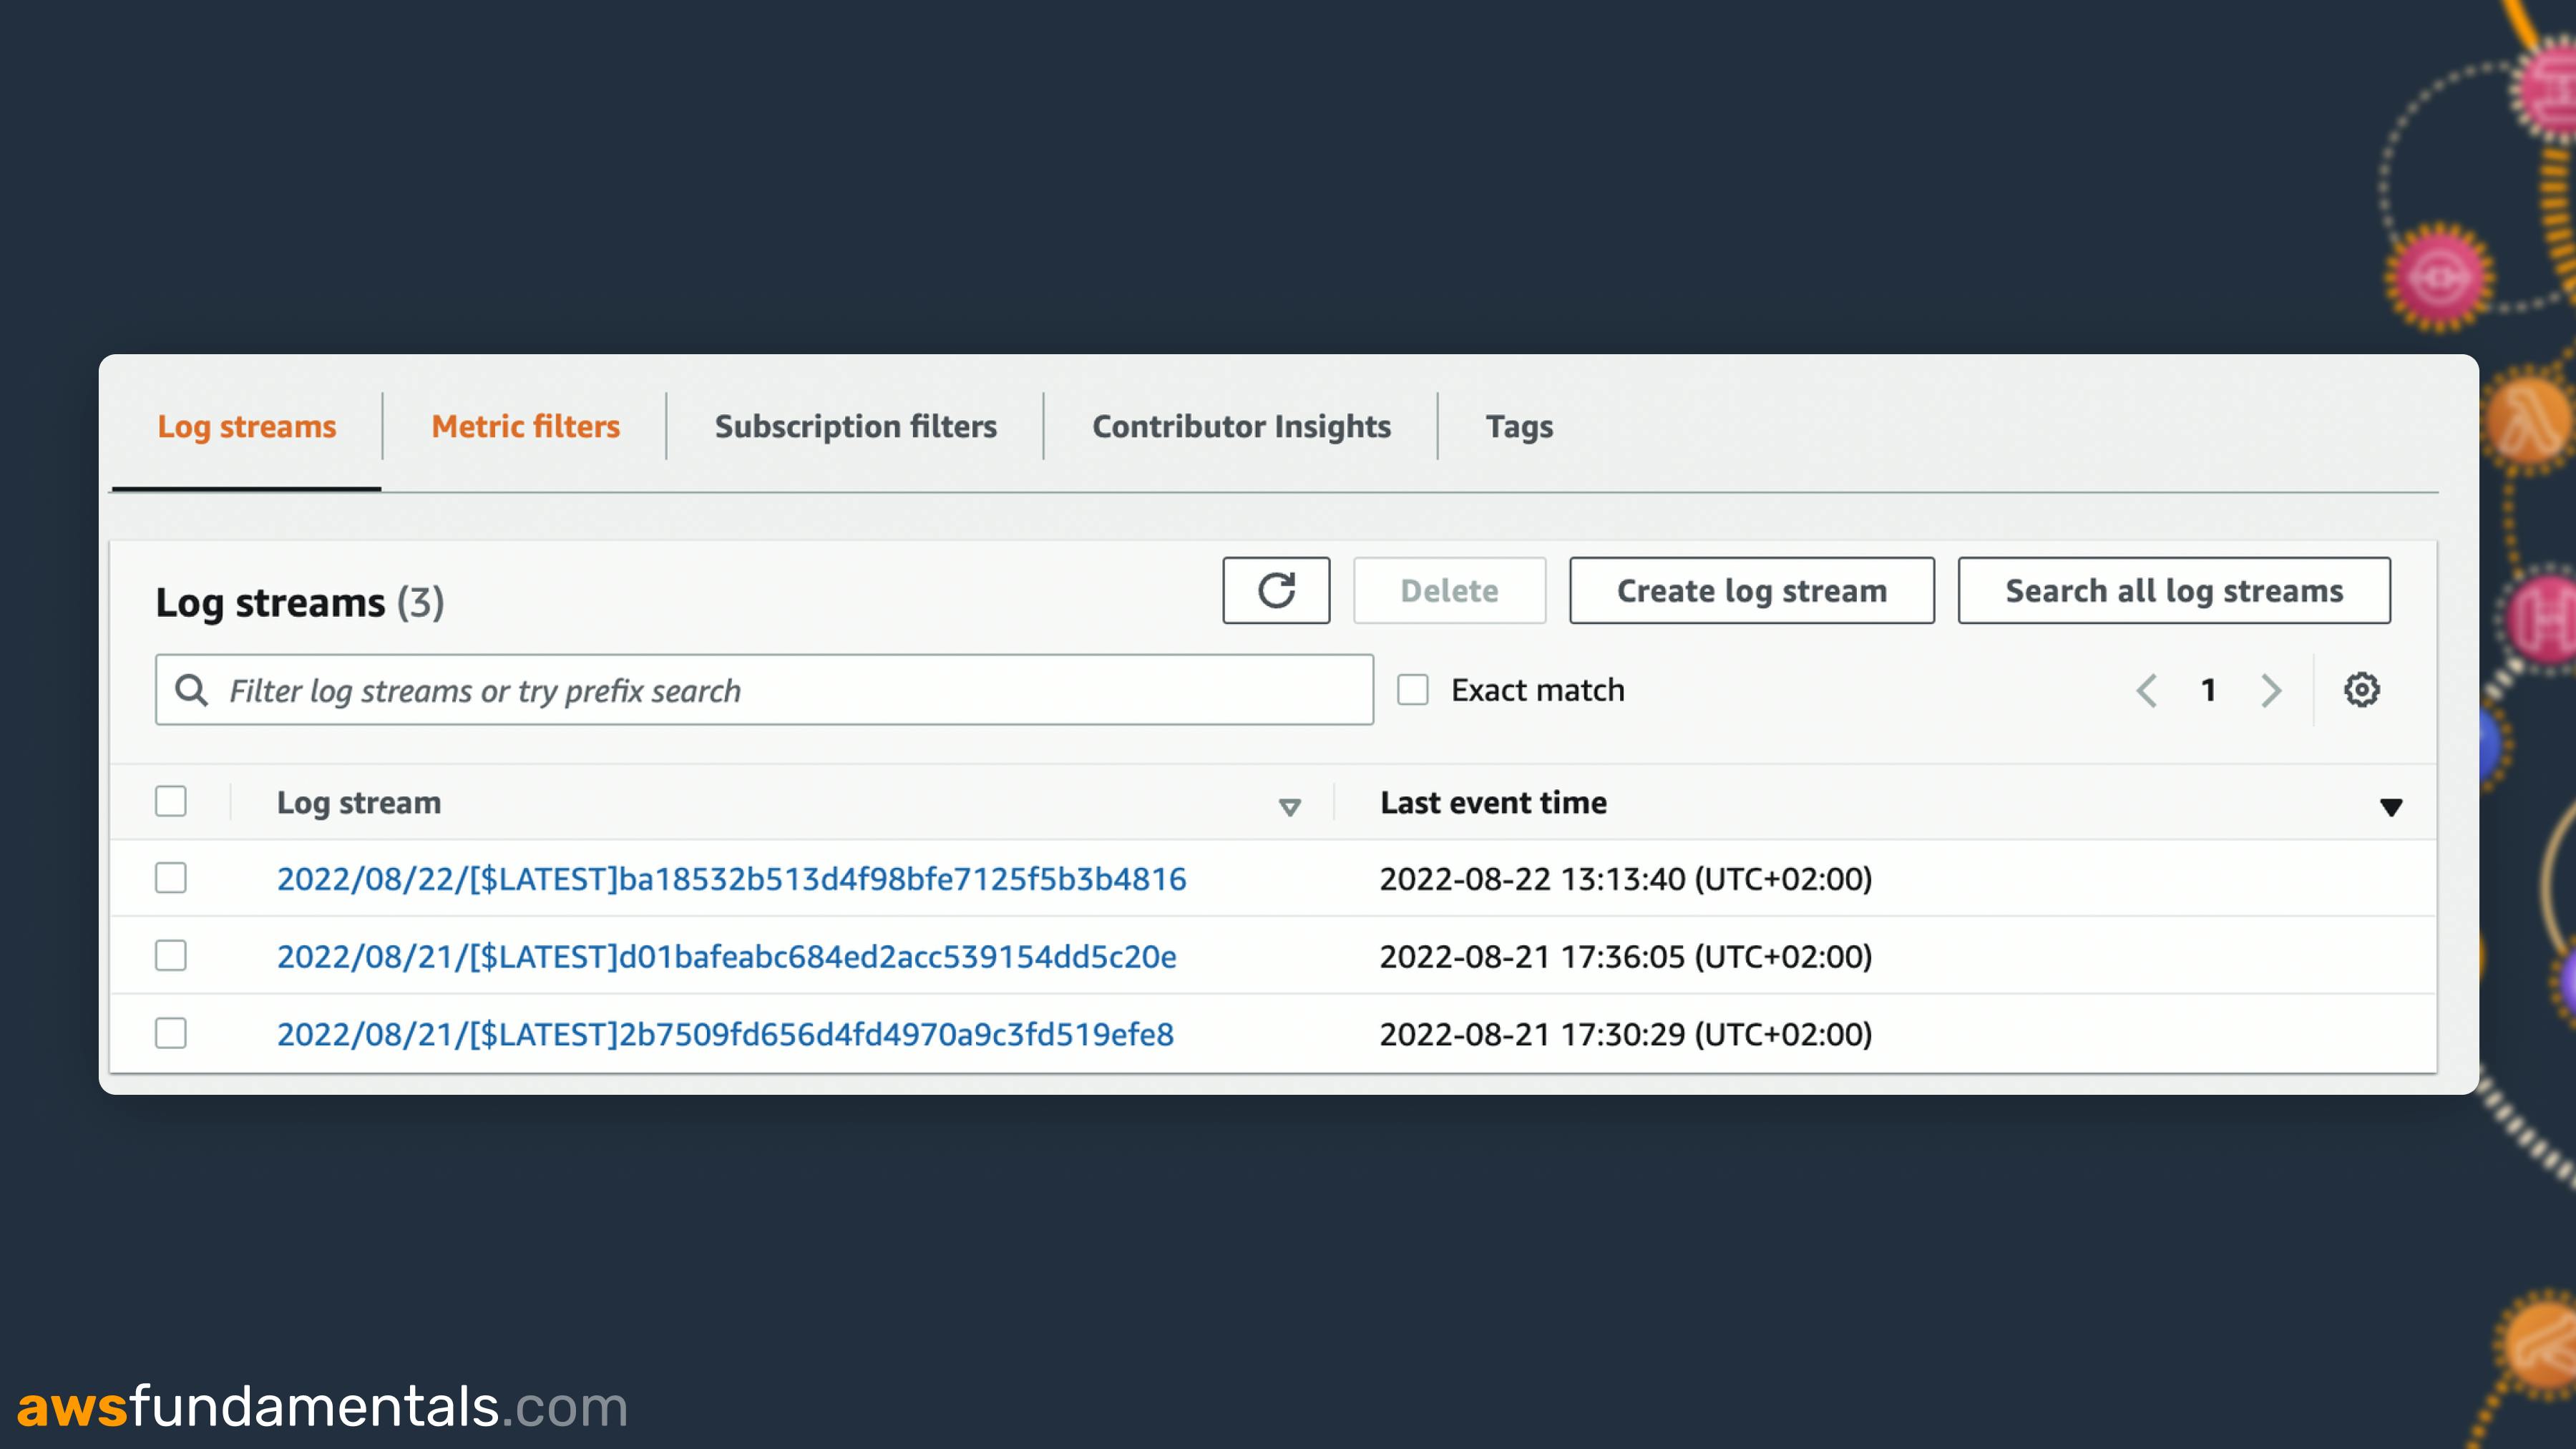
If we continue on our Lambda example, one Log Stream would be all Logs of one running Lambda container. For example, if your Lambda container runs for 15 minutes and receives 10 requests within the same container. All of these logs will be present in the same Log Stream.
Log Groups - All Log Streams of one Application
Log Groups is the highest order of the Logs concept. One Log Group is dedicated to one application of service.
For a Lambda function named thumbnail the dedicated Log Group would be: /aws/lambda/thumbnail
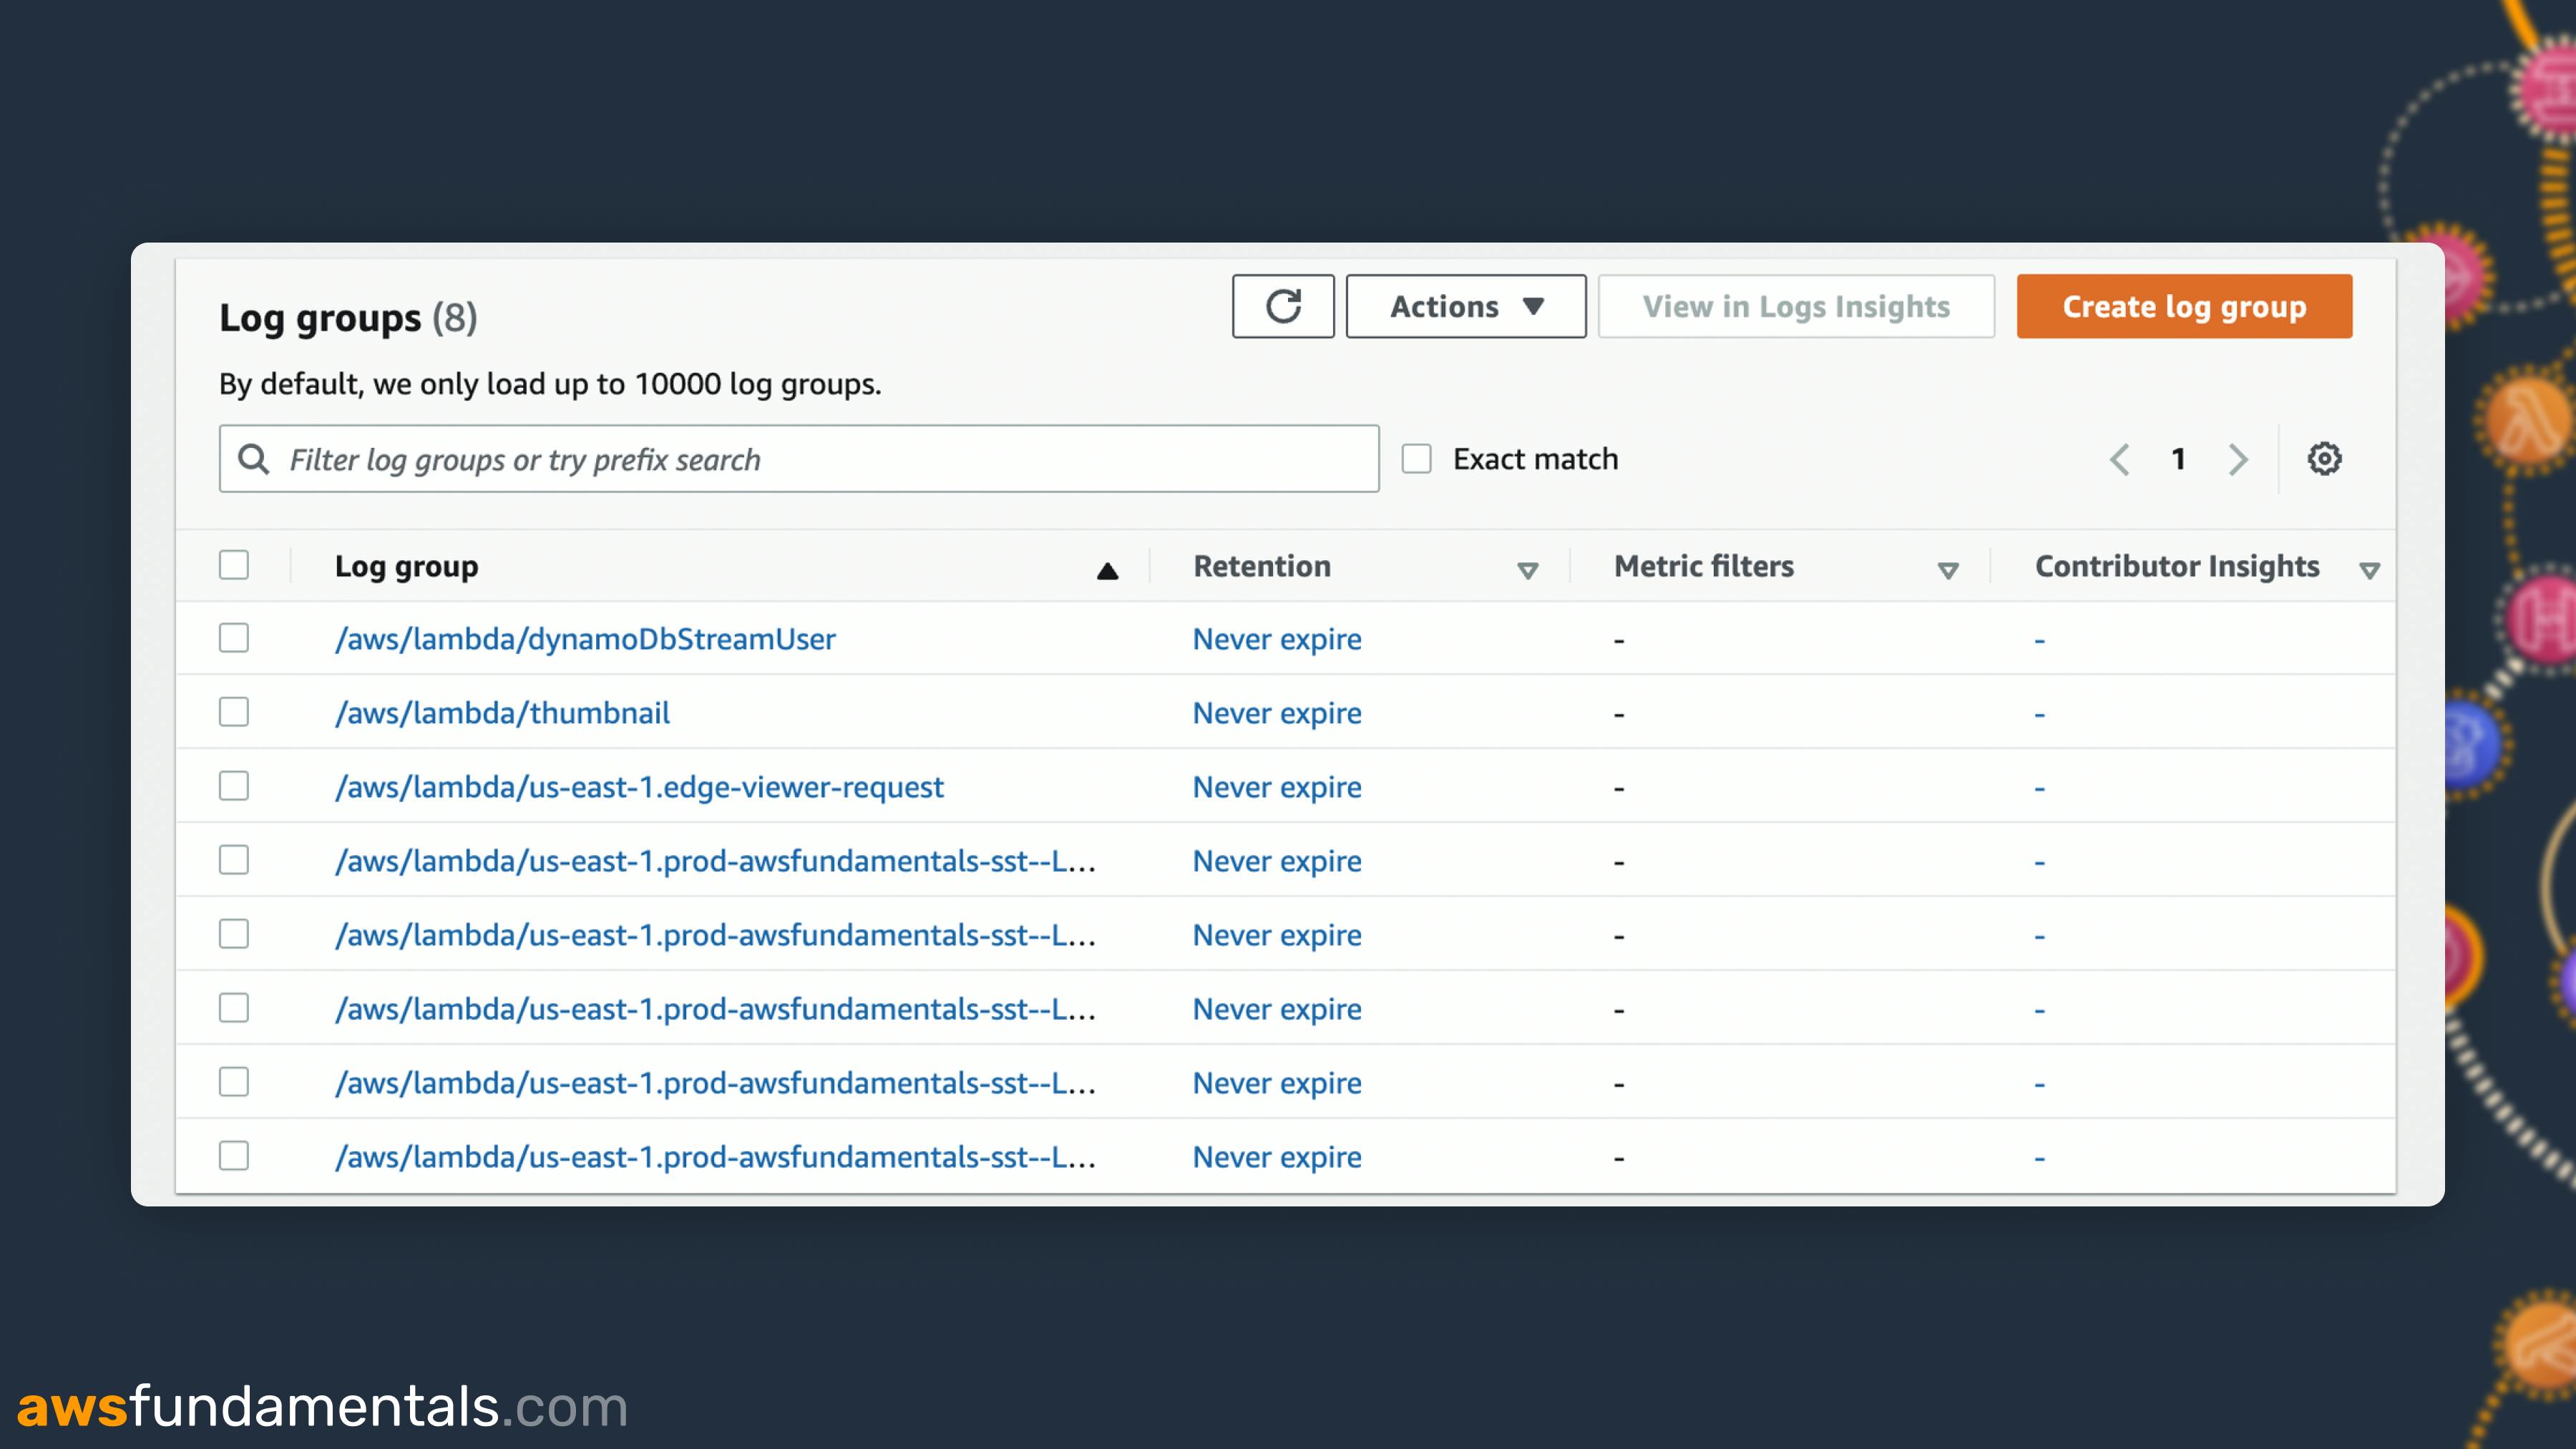
In this screenshot, you can see the log group /aws/lambda/thumbnail. This one holds all Log Streams that were executed from this Lambda function.
You can set a retention setting on each Log Group. The retention defines how long logs will be stored. By default, this is set to Never Expire. If you have a production application that logs a lot make sure to change this setting. Especially on your test and dev services. This can incur a lot of costs.
CloudWatch Log Insights
What is CloudWatch Log Insights?
Debugging user requests across several services, Lambda Functions, and APIs can be quite challenging. This is what CloudWatch Log Insights helps you with.
CloudWatch Log Insights allows you to query multiple Log Groups with a SQL-like syntax.
In a typical production environment, you will log your log messages with a dedicated JSON logger. A JSON logger allows you to query fields. Typically, you will have correlation IDs available. Correlation IDs are IDs that allow you to trace requests across different sessions. Often you will add request or user IDs as correlation IDs.
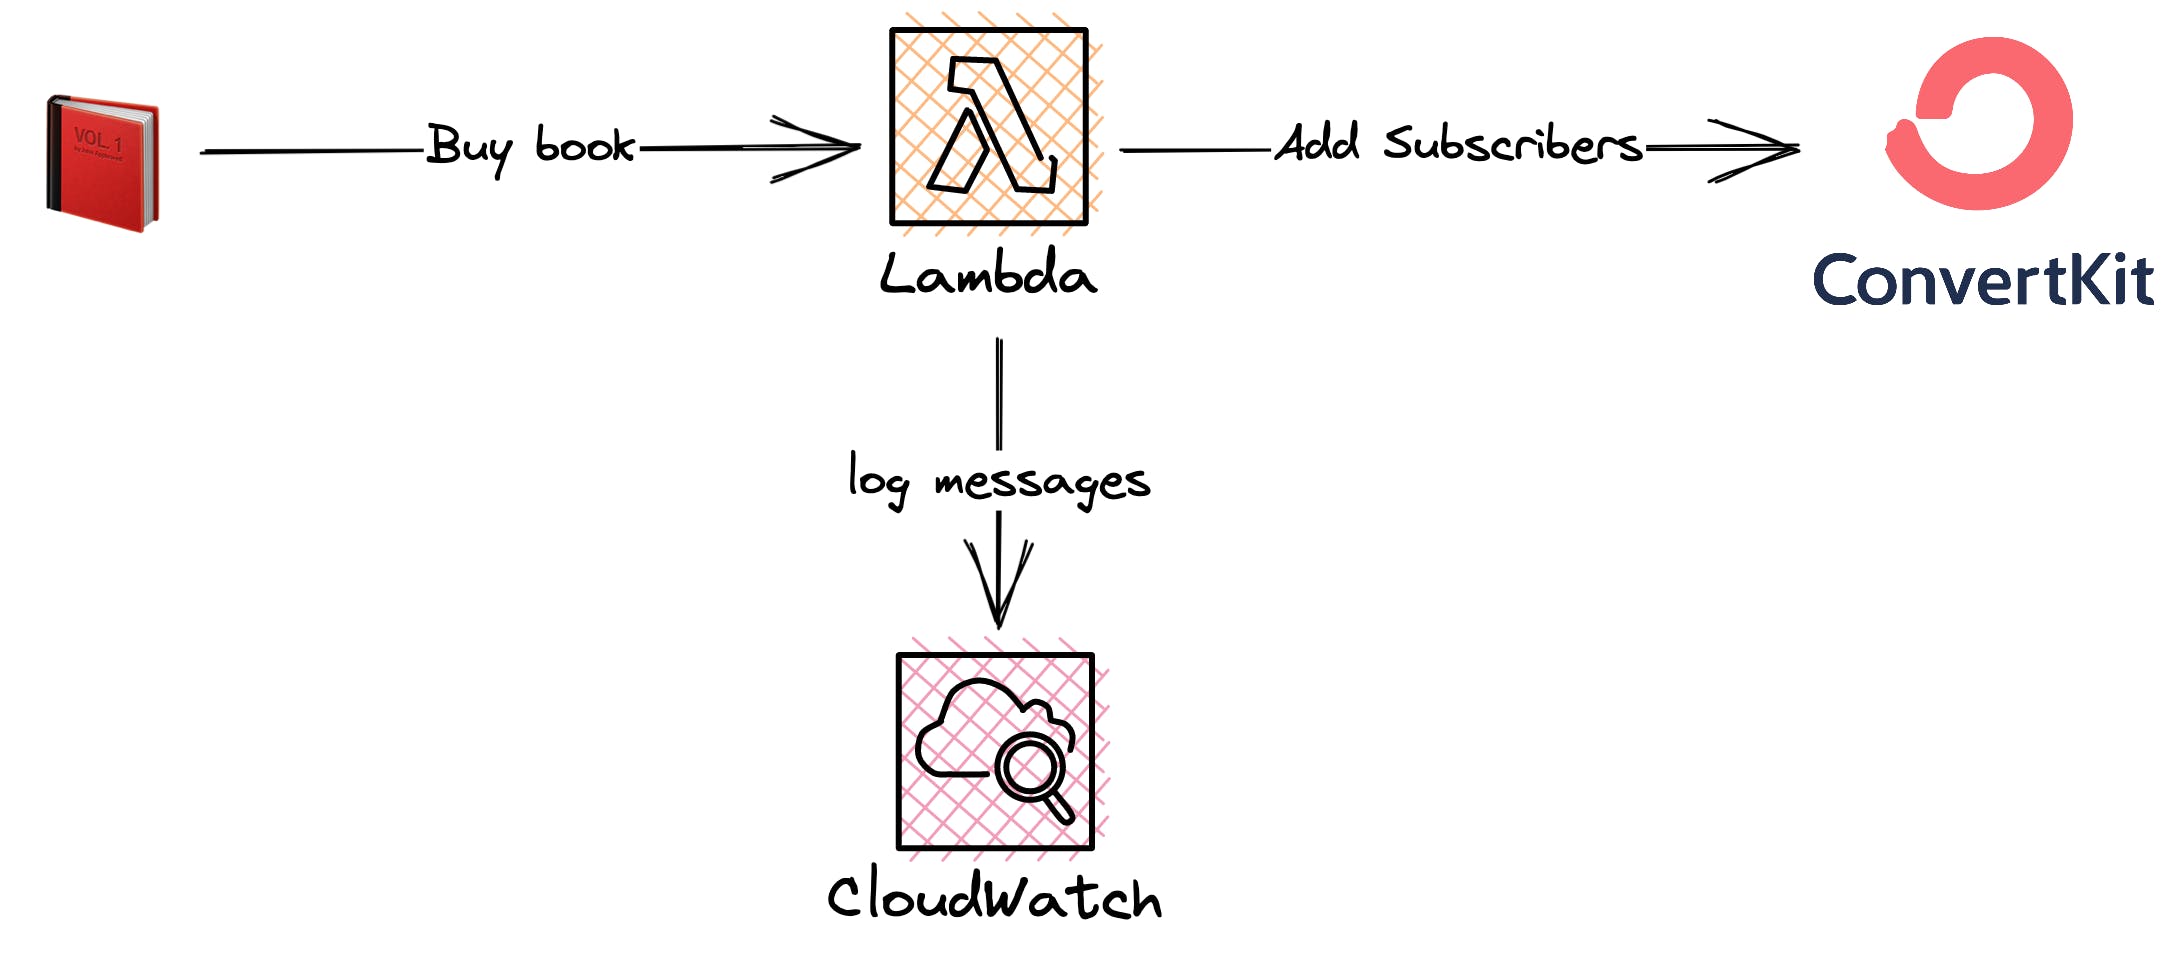
We will use a Lambda of AWS Fundamentals as an example. This Lambda function will be called via a webhook once a purchase of our book was made. The Lambda function adds the subscriber to Converkit, our E-Mail Provider.
How does CloudWatch Log Insights Work?
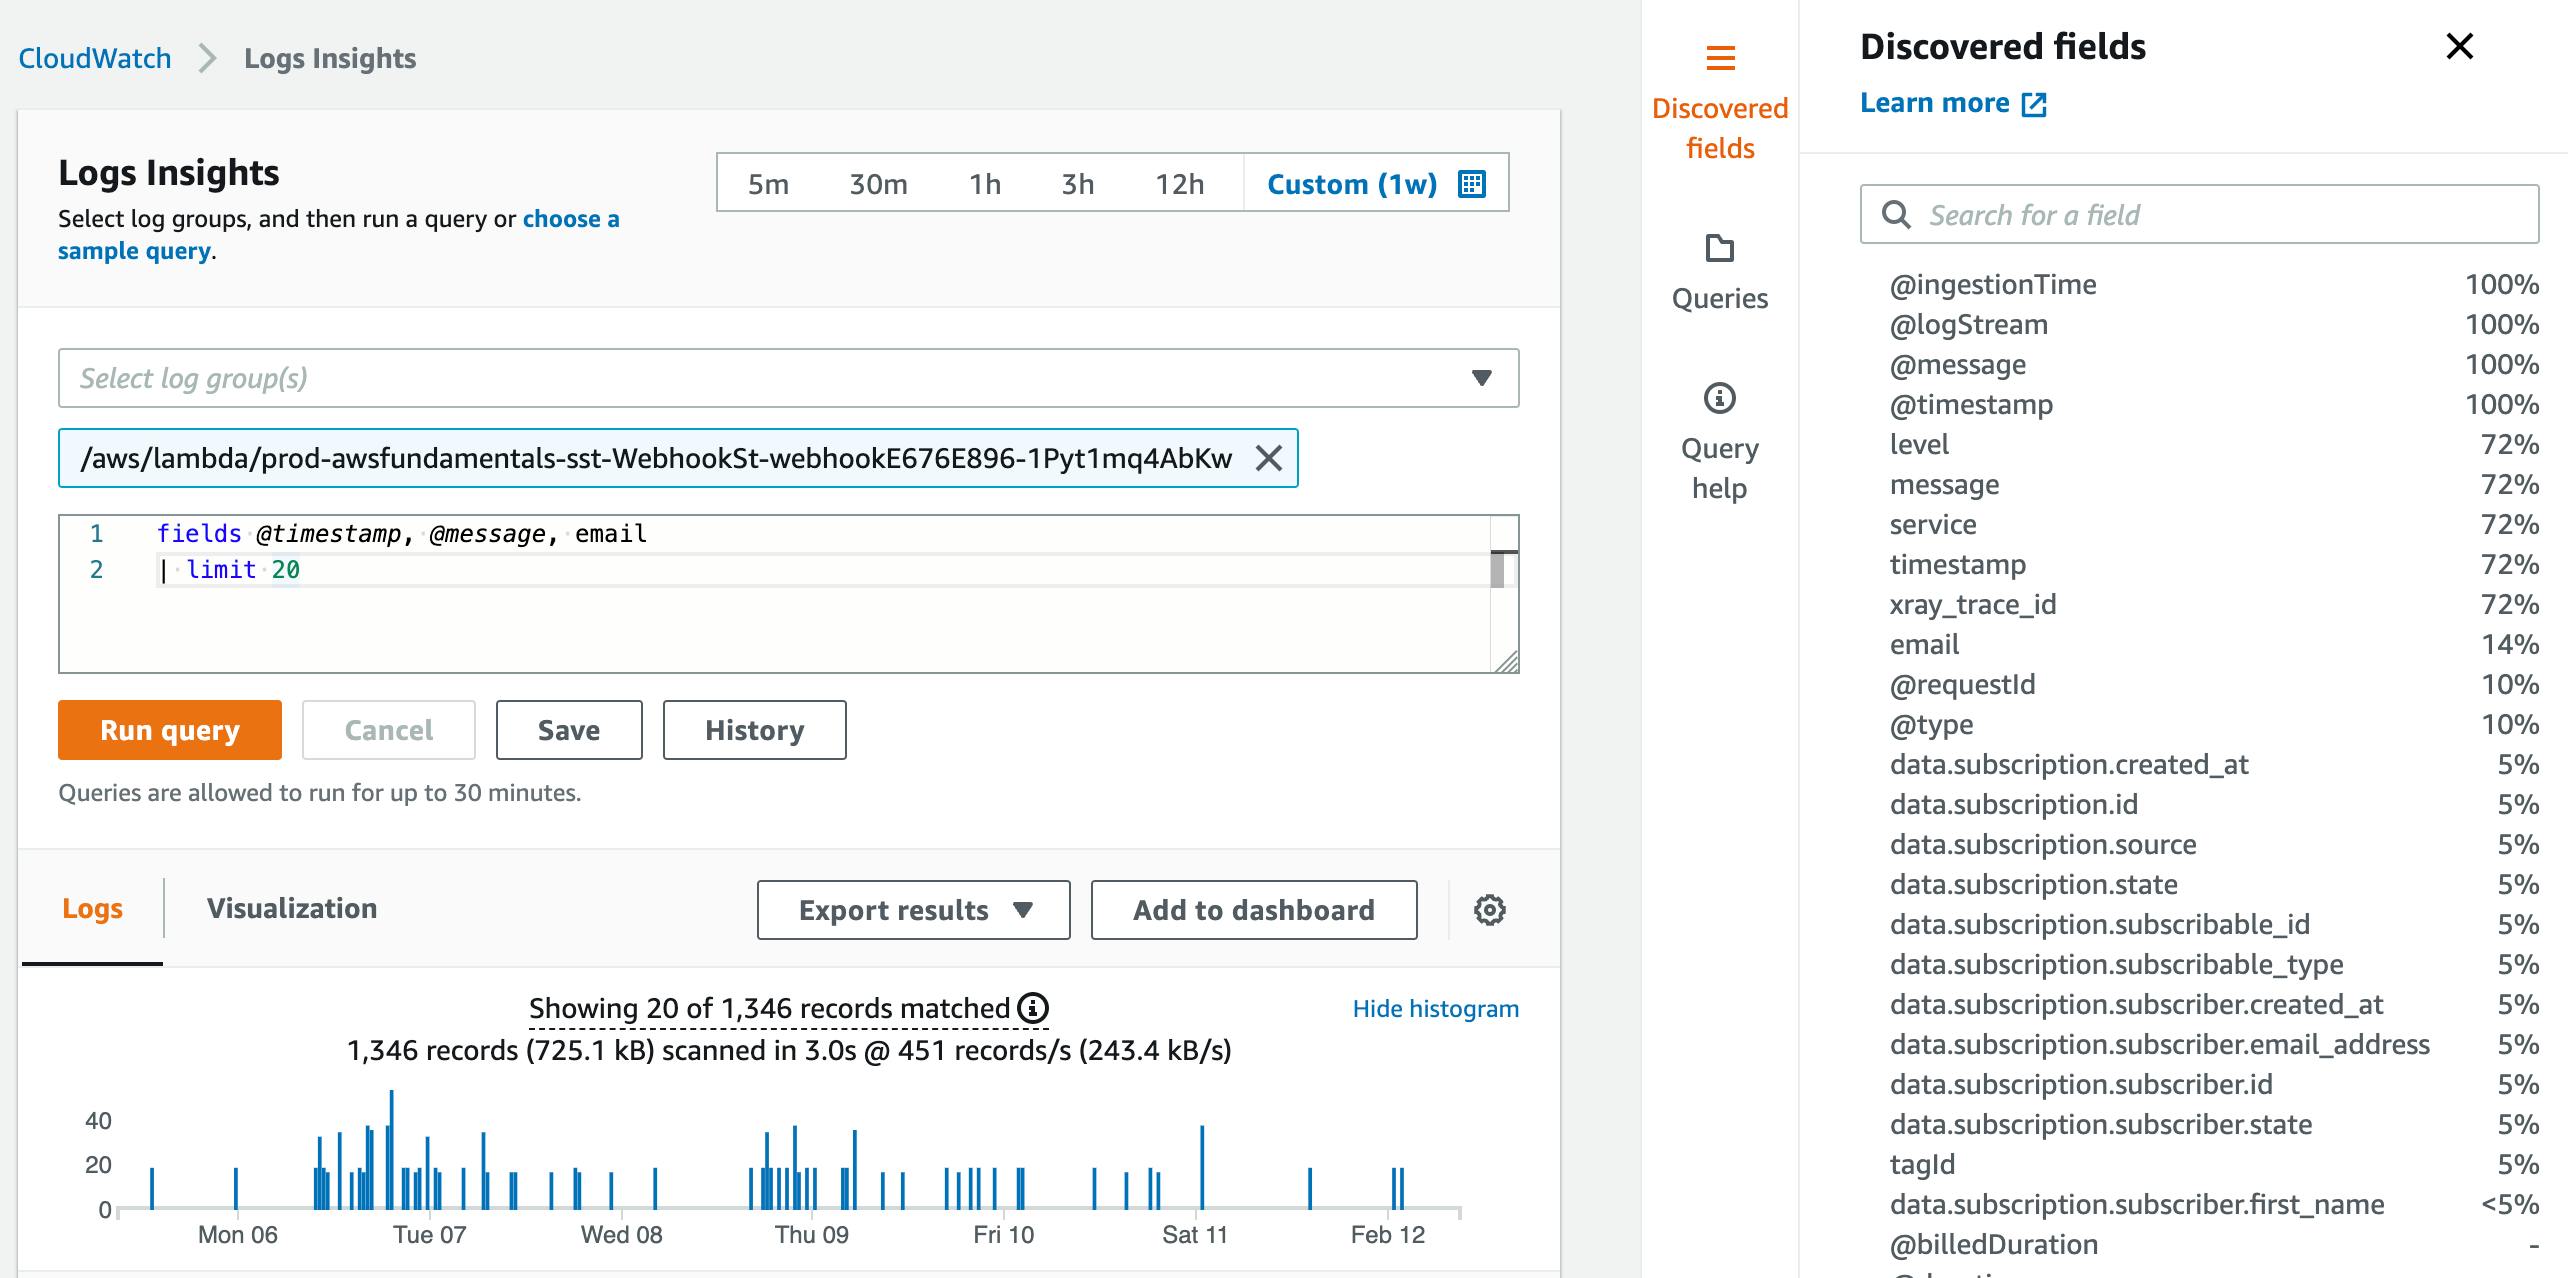
This is what the UI of Log Insights looks like:
There are several different parts of the UI you need to understand before you can work with it.
The Editor
Log Insights has a small editor with which you can create your queries.
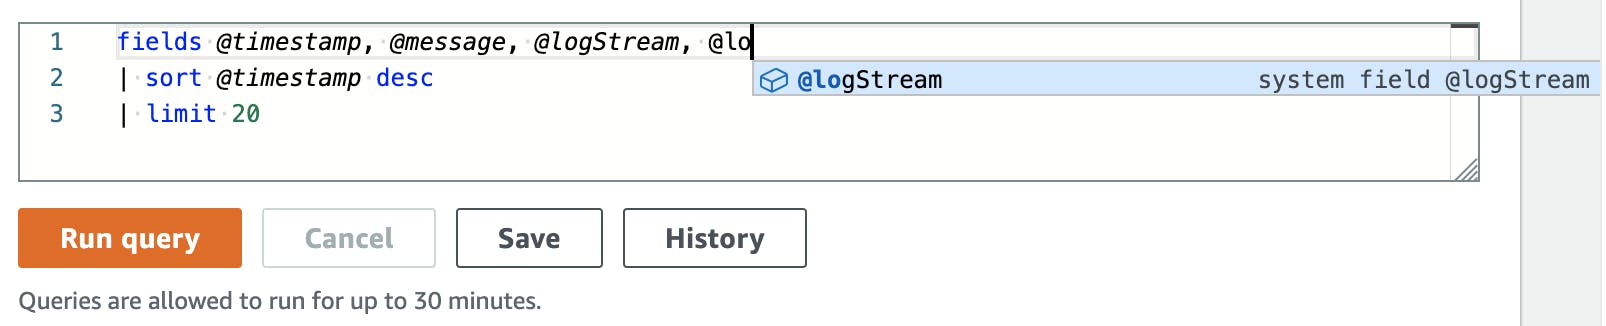
The editor also can auto-suggest fields and functionalities in Log Insights. We see queries in more detail later.
Choosing Log Groups
The magic of Log Insights is that you can choose one or more Log Groups. In the top pane, you can choose your Log Groups. Here is an example of our AWS Fundamentals Log Groups:
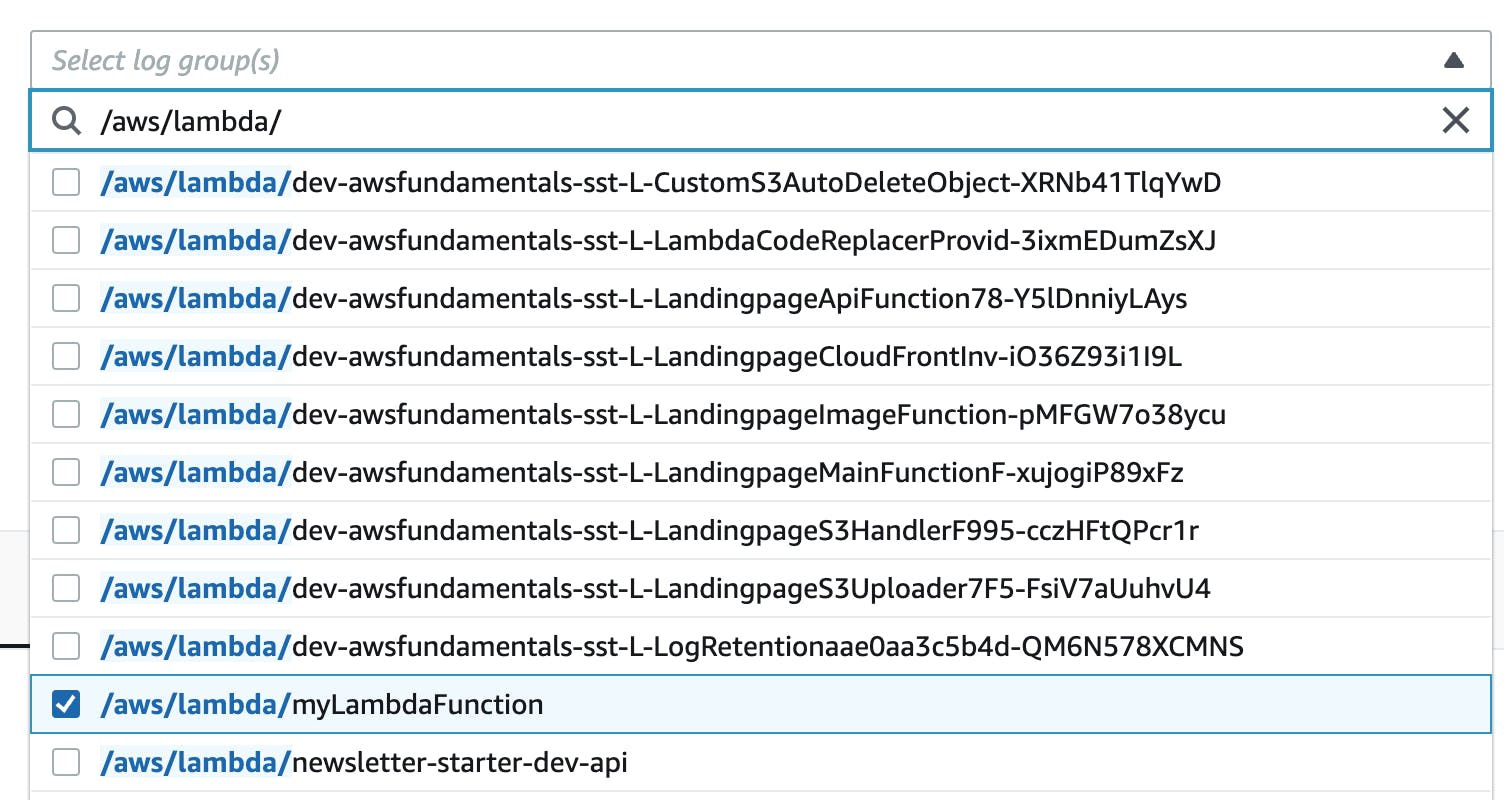
Select one or more Log Groups here.
Fields
Each Log Group has different fields to query from. Fields are the attributes in your log. If we take this log as an example:
{
    "message": "This is a message",
    "level": "DEBUG",
    "email": "alessandro.volpicella@gmail.com",
...
}
All keys here are fields to query from. For example
messagelevelemail
Log Insights shows you which fields are available after you run your query once. On the right side pane, you can see the tab Discovered Fields. It also shows you how often the fields are available in the different log messages.
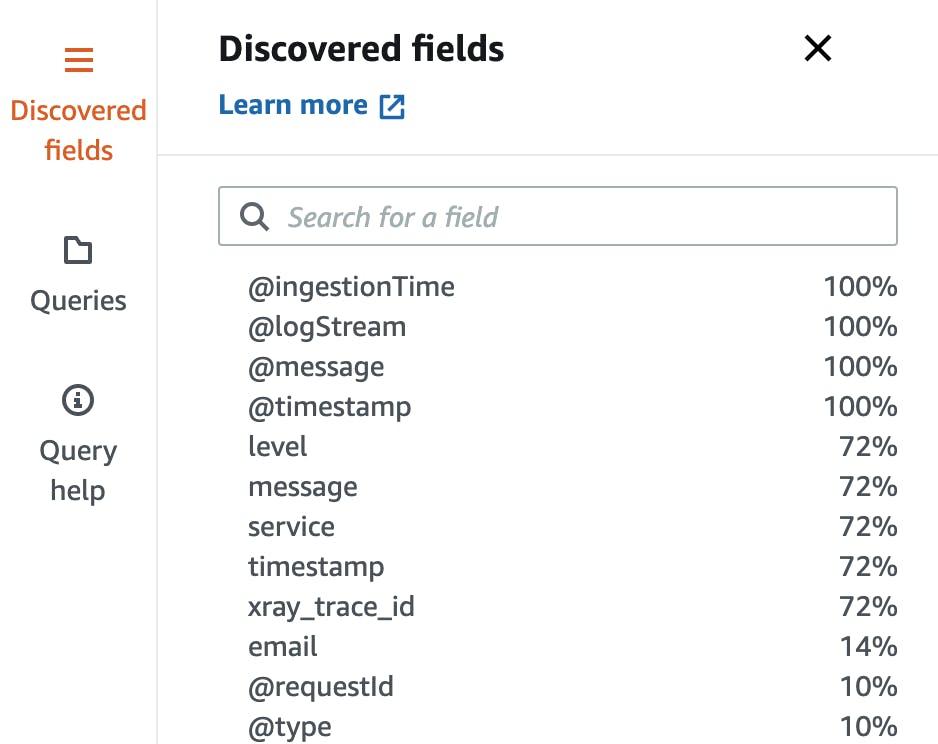
While we can see in the screenshot that the field @timestamp is always available, the field email is only available in 14% of the logs.
Queries - Premade Queries
There is another tab called Queries. Log Insights has some prepared Queries for you.
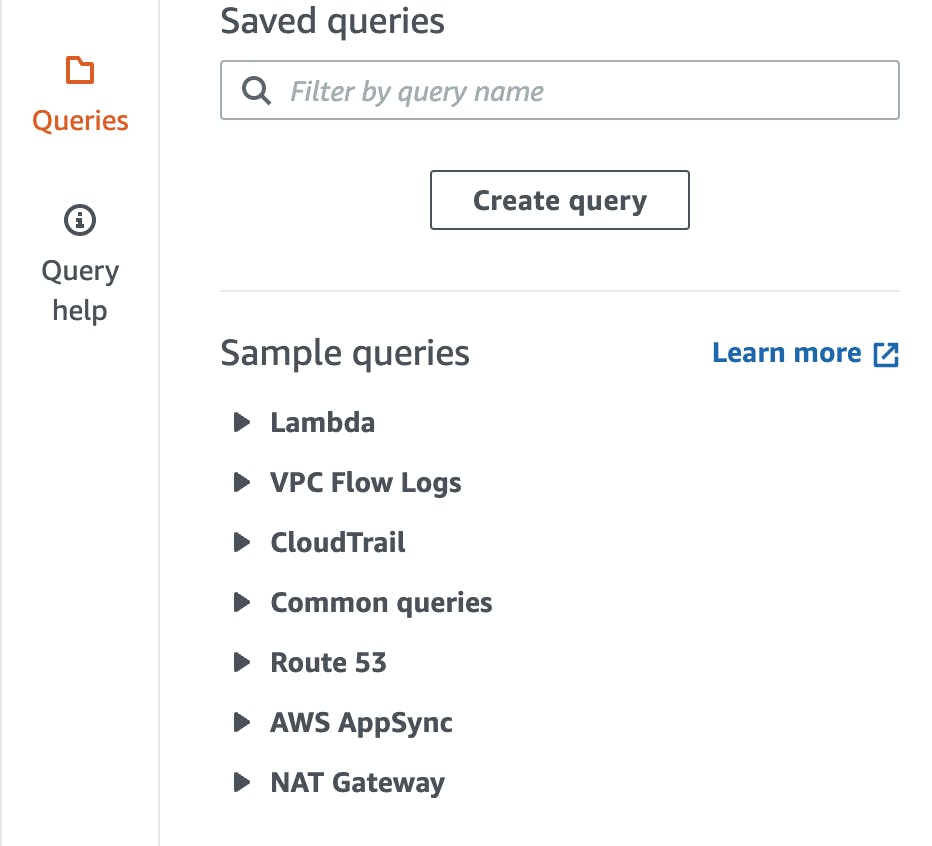
These queries help you a lot in getting started with querying your logs. Here are some example queries:
Find the most expensive Lambda Requests
Get the latest 25 Log Events
Get the average latency for your API
Example Log Insights Query
Let's see an example query. The Webhook Lambda function logs messages to CloudWatch with the e-mail attached. We want to find all logs that contain a certain e-mail address.
{
    "level": "INFO",
    "message": "New Subscriber",
    "service": "webhook",
    "timestamp": "2023-02-02T13:45:44.089Z",
    "xray_trace_id": "1-63dbbe87-4a67d38823a567956b257c69",
    "variant_id": 36443,
    "email": "alessandro.volpicella@gmail.com"
}
Let's build a query that finds only logs with this email address:
fields @timestamp, @message, email, @logStream
| filter email = "alessandro.volpicella@gmail.com"
| limit 20
This query looks pretty much like SQL. Let's understand this query in a bit more detail.
Fields: Fields are all fields you want to see in the output. We are only interested in the timestamp and the whole message.
Filter: Filter allows you to filter all requests on some identifier. We want to see all logs for the email address alessandro.volpicella@gmail.com
Sort: We can sort our data by the timestamp.
Limit: Let's limit the results to 20 results.
The final result would look like this:
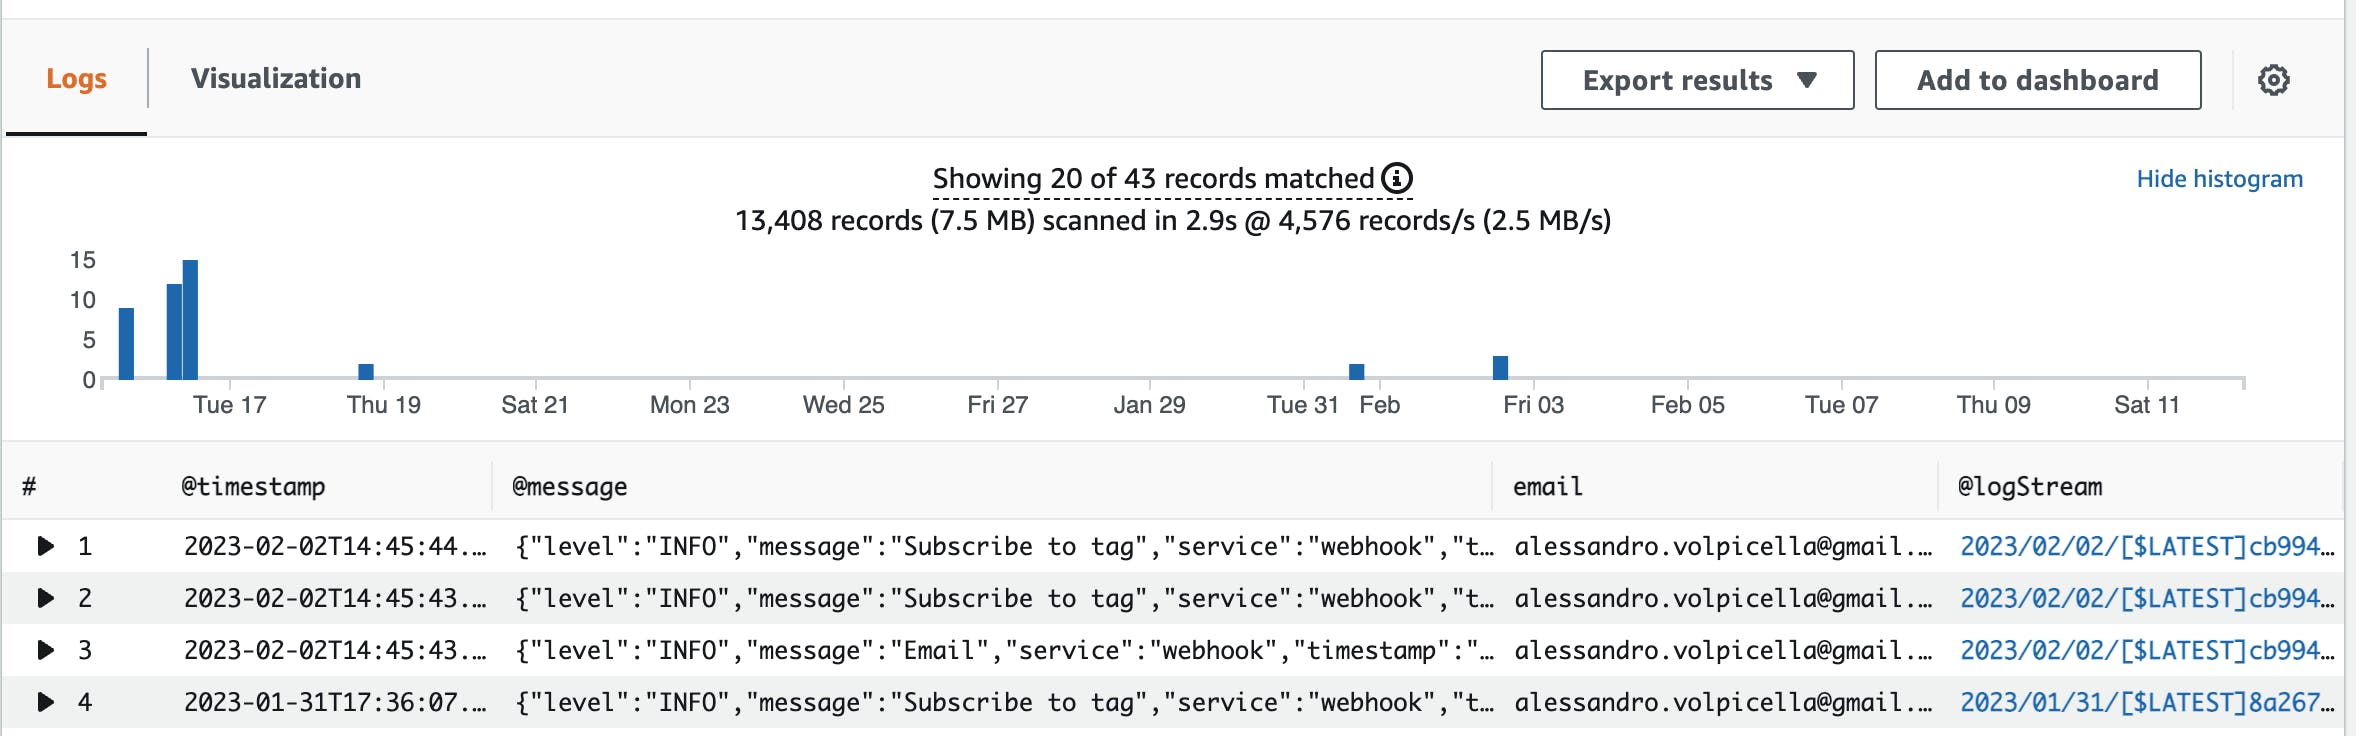
Now we see all queries that are attached to this email address.
Advanced Queries
The query we saw in the last example is pretty standard. Log Insights has much more capability when it comes to creating statistics and reports around your data.
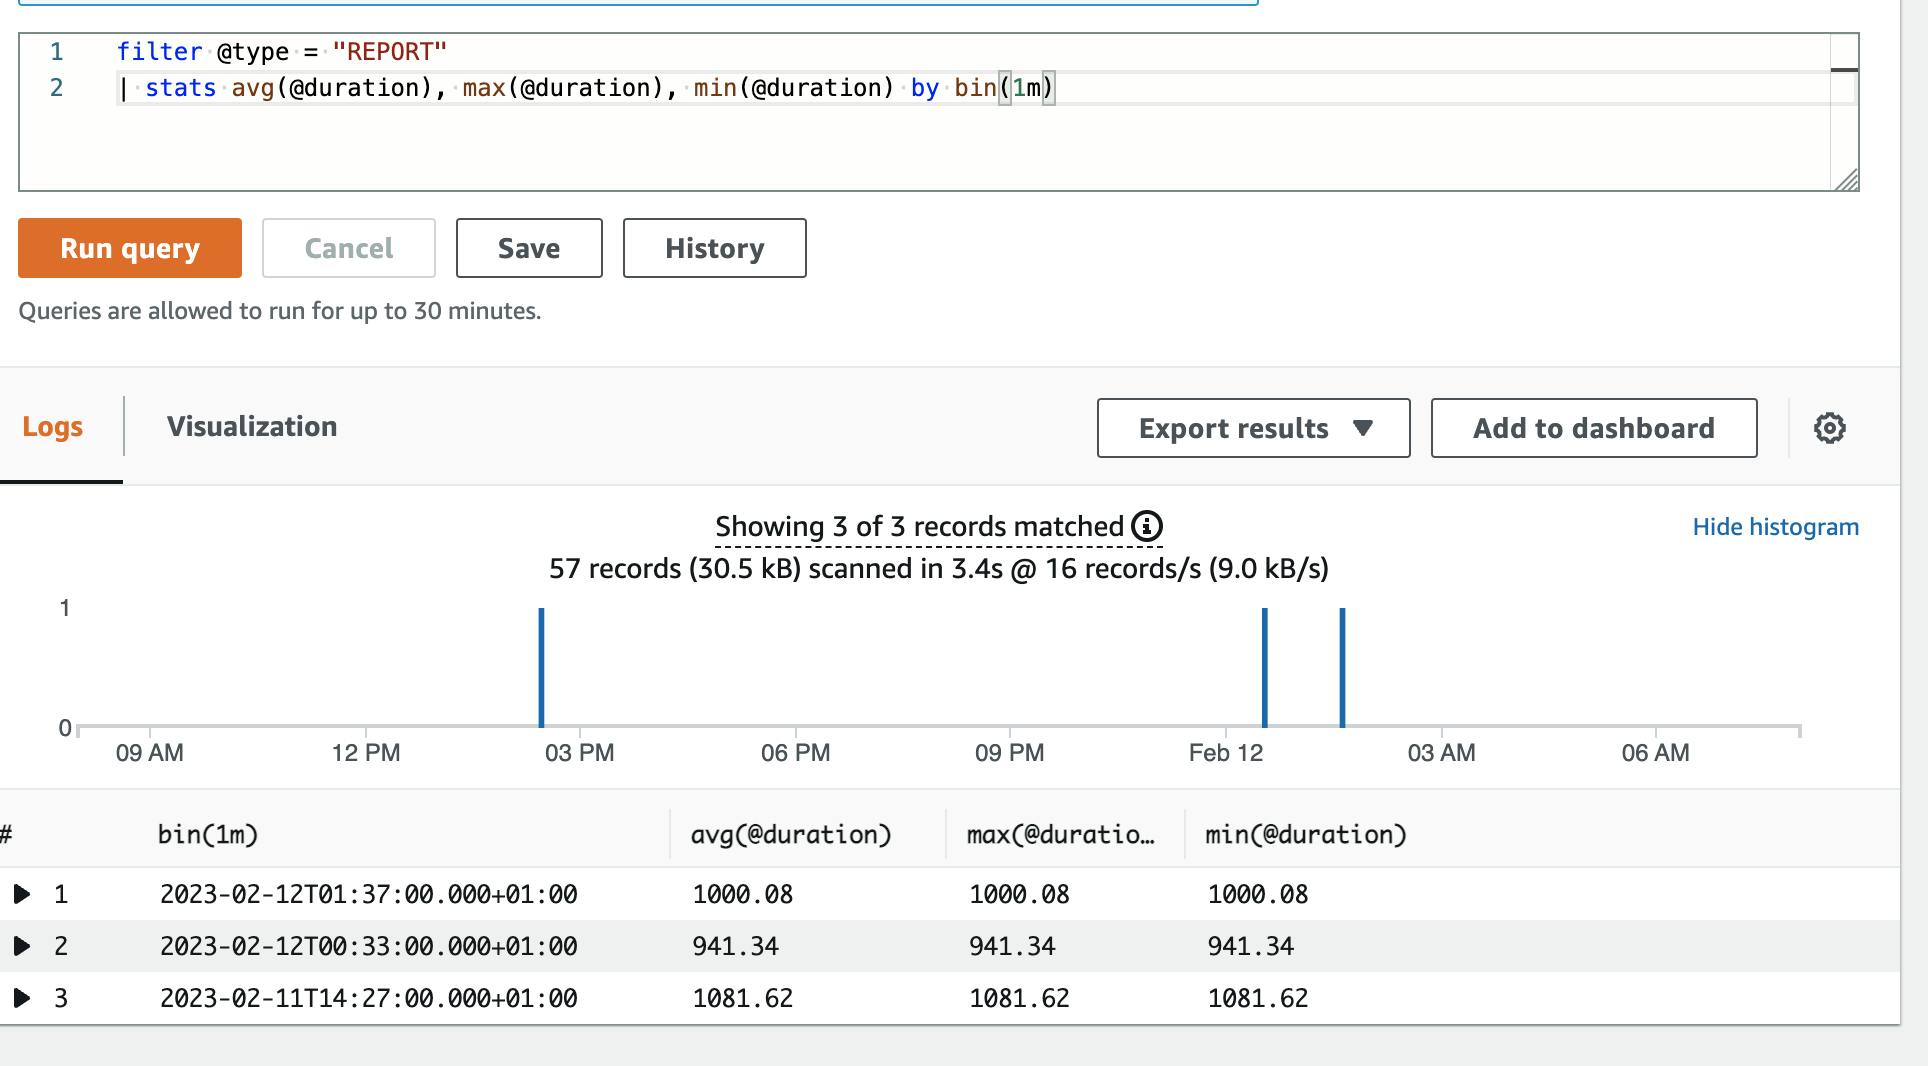
Lambda Duration - Average, Max, Min
This query creates a report with some statistics around my Lambda function.
filter @type = "REPORT"
| stats avg(@duration), max(@duration), min(@duration) by bin(1m)
It calculates the average, maximum, and minimum duration of my Lambda function in 1-minute bins.
Most Expensive Lambda
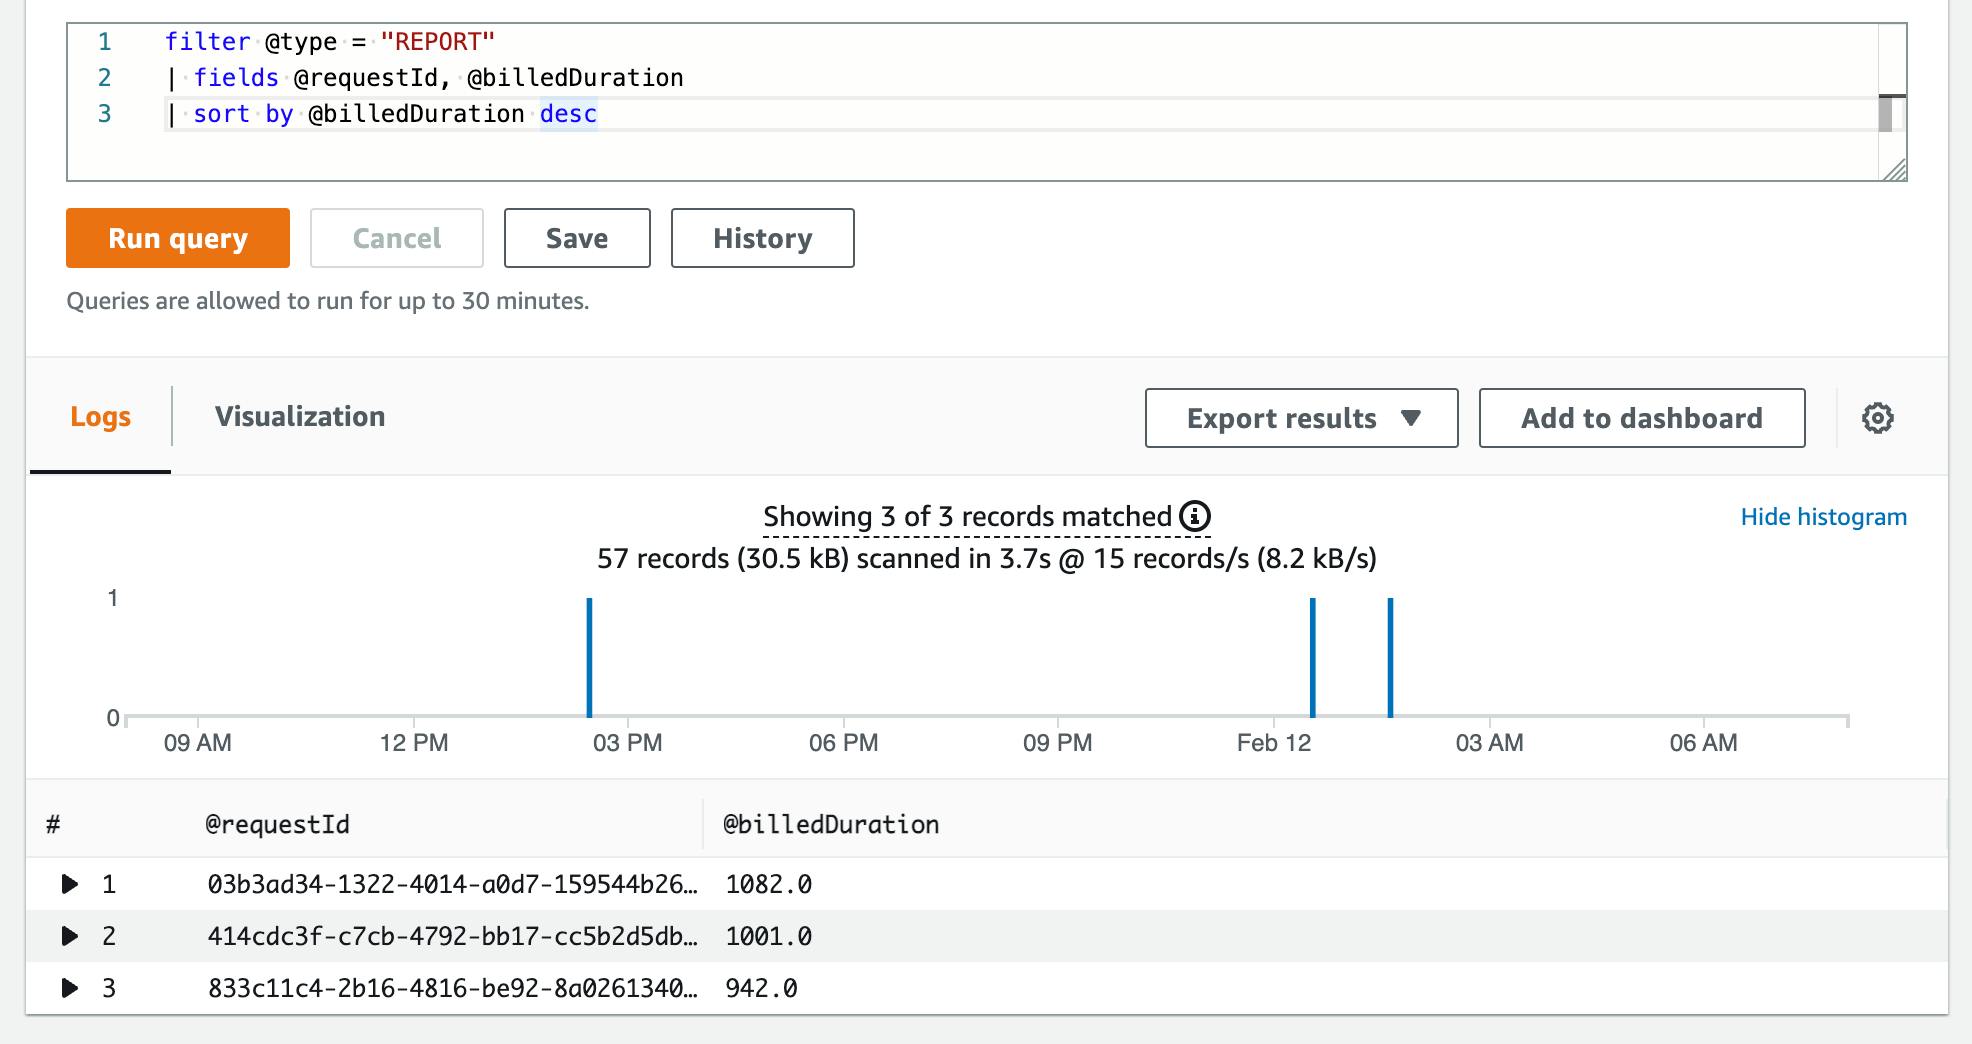
You can also find the most expensive Lambda function with this query:
filter @type = "REPORT"
| fields @requestId, @billedDuration
| sort by @billedDuration desc
Lambda already gives you the field @billedDuration. This field indicates how long your Lambda ran, and therefore how much it costs.
By using the @type=REPORT and functions from the stats group it is much easier to create ad-hoc analytics queries.
Save Queries
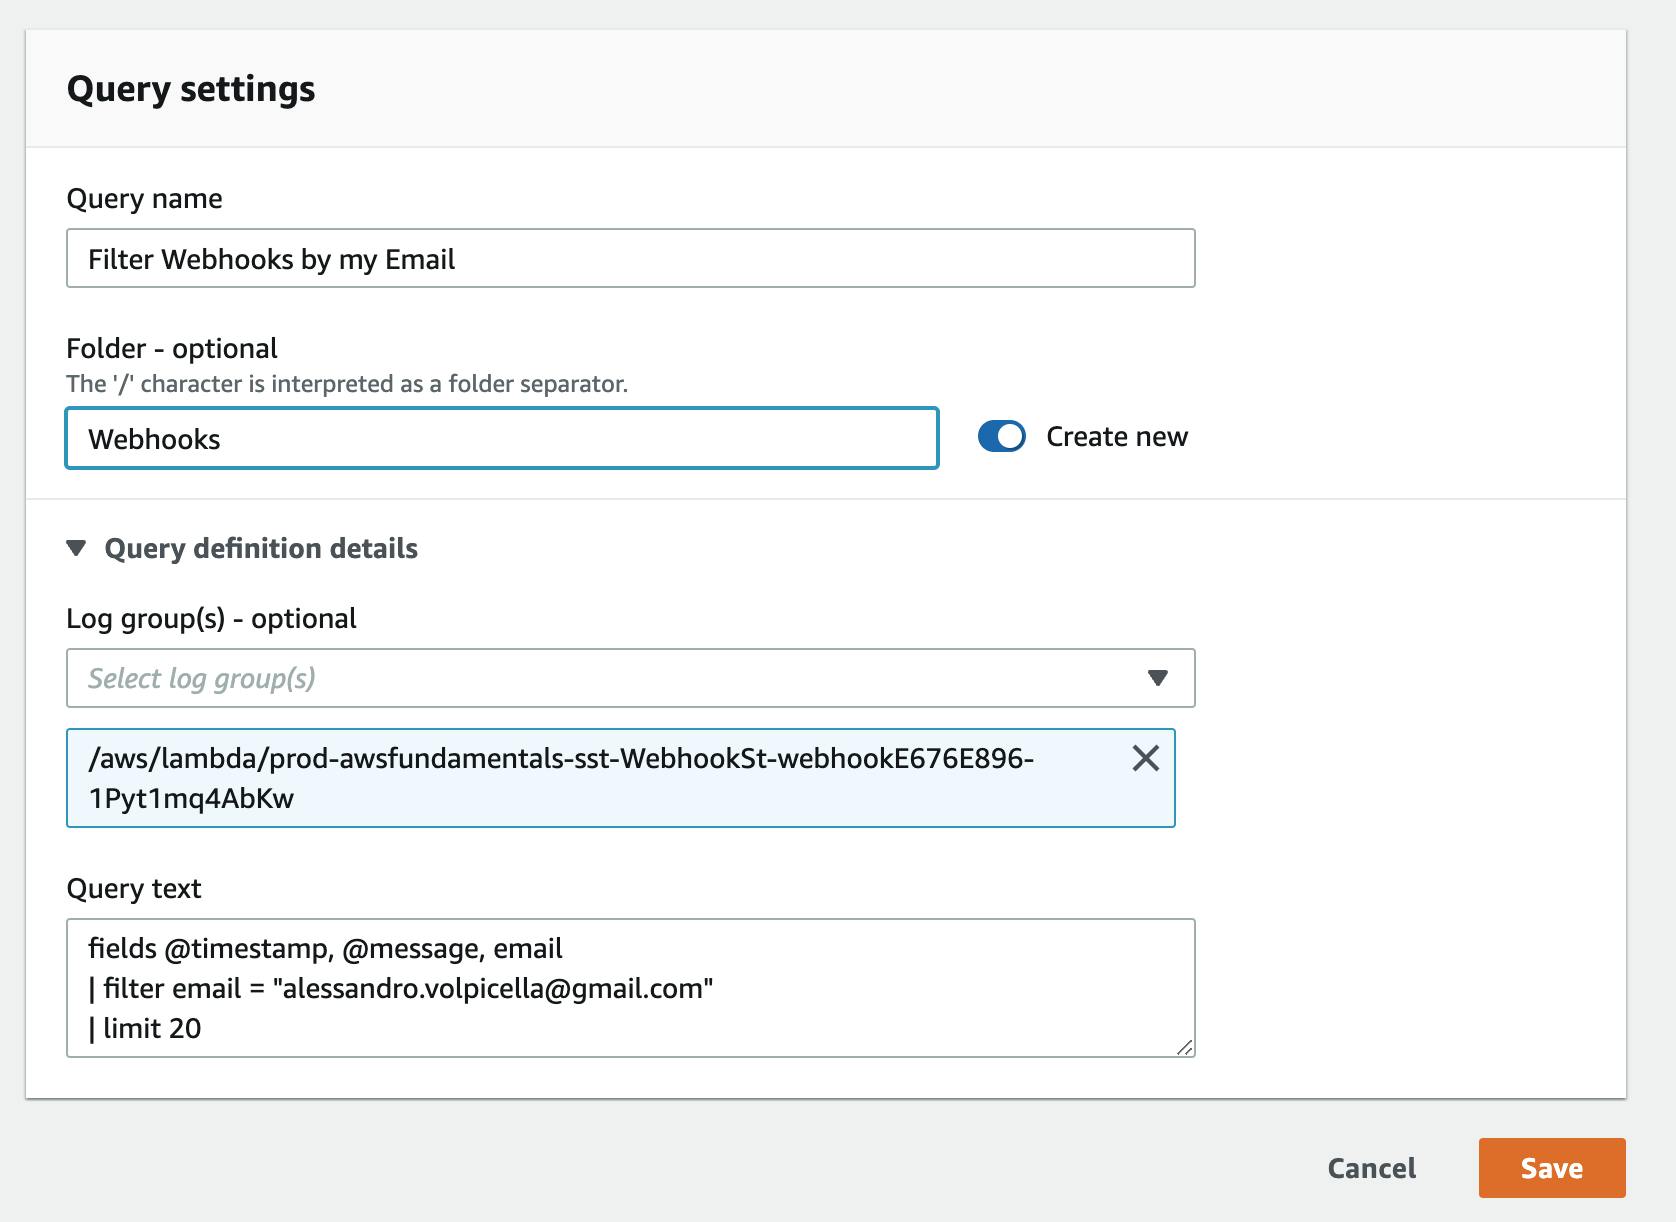
While AWS already prepared some queries for you, you can do the same. Once you've built your query hit the save button and save it.
With that, your other team members can also use the queries if they need to query the data.
For example, I want to save a query that filters all webhook requests by my e-mail address. The query looks like that:
fields @timestamp, @message, email
| filter email = "alessandro.volpicella@gmail.com"
| limit 20
Once I hit Save I see the following pane. I can create a folder and name my query.
Log Insights give you an amazing functionality to trace requests across multiple Log Groups by common identifiers. By using it you can use AWS-native monitoring tools almost for free.
CloudWatch Metrics
What are CloudWatch Metrics?
CloudWatch Metrics is another amazing functionality of CloudWatch. CloudWatch acts as a metrics repository. Each application and service sends metrics directly to CloudWatch.
Let's use Lambda as an example again. Example metrics for Lambda are:
Number of invocations
Execution time of the Lambda
Number of errors
You can also use statistical functions like averages, sums, or medians. You can create a dashboard to present these metrics to your stakeholders.
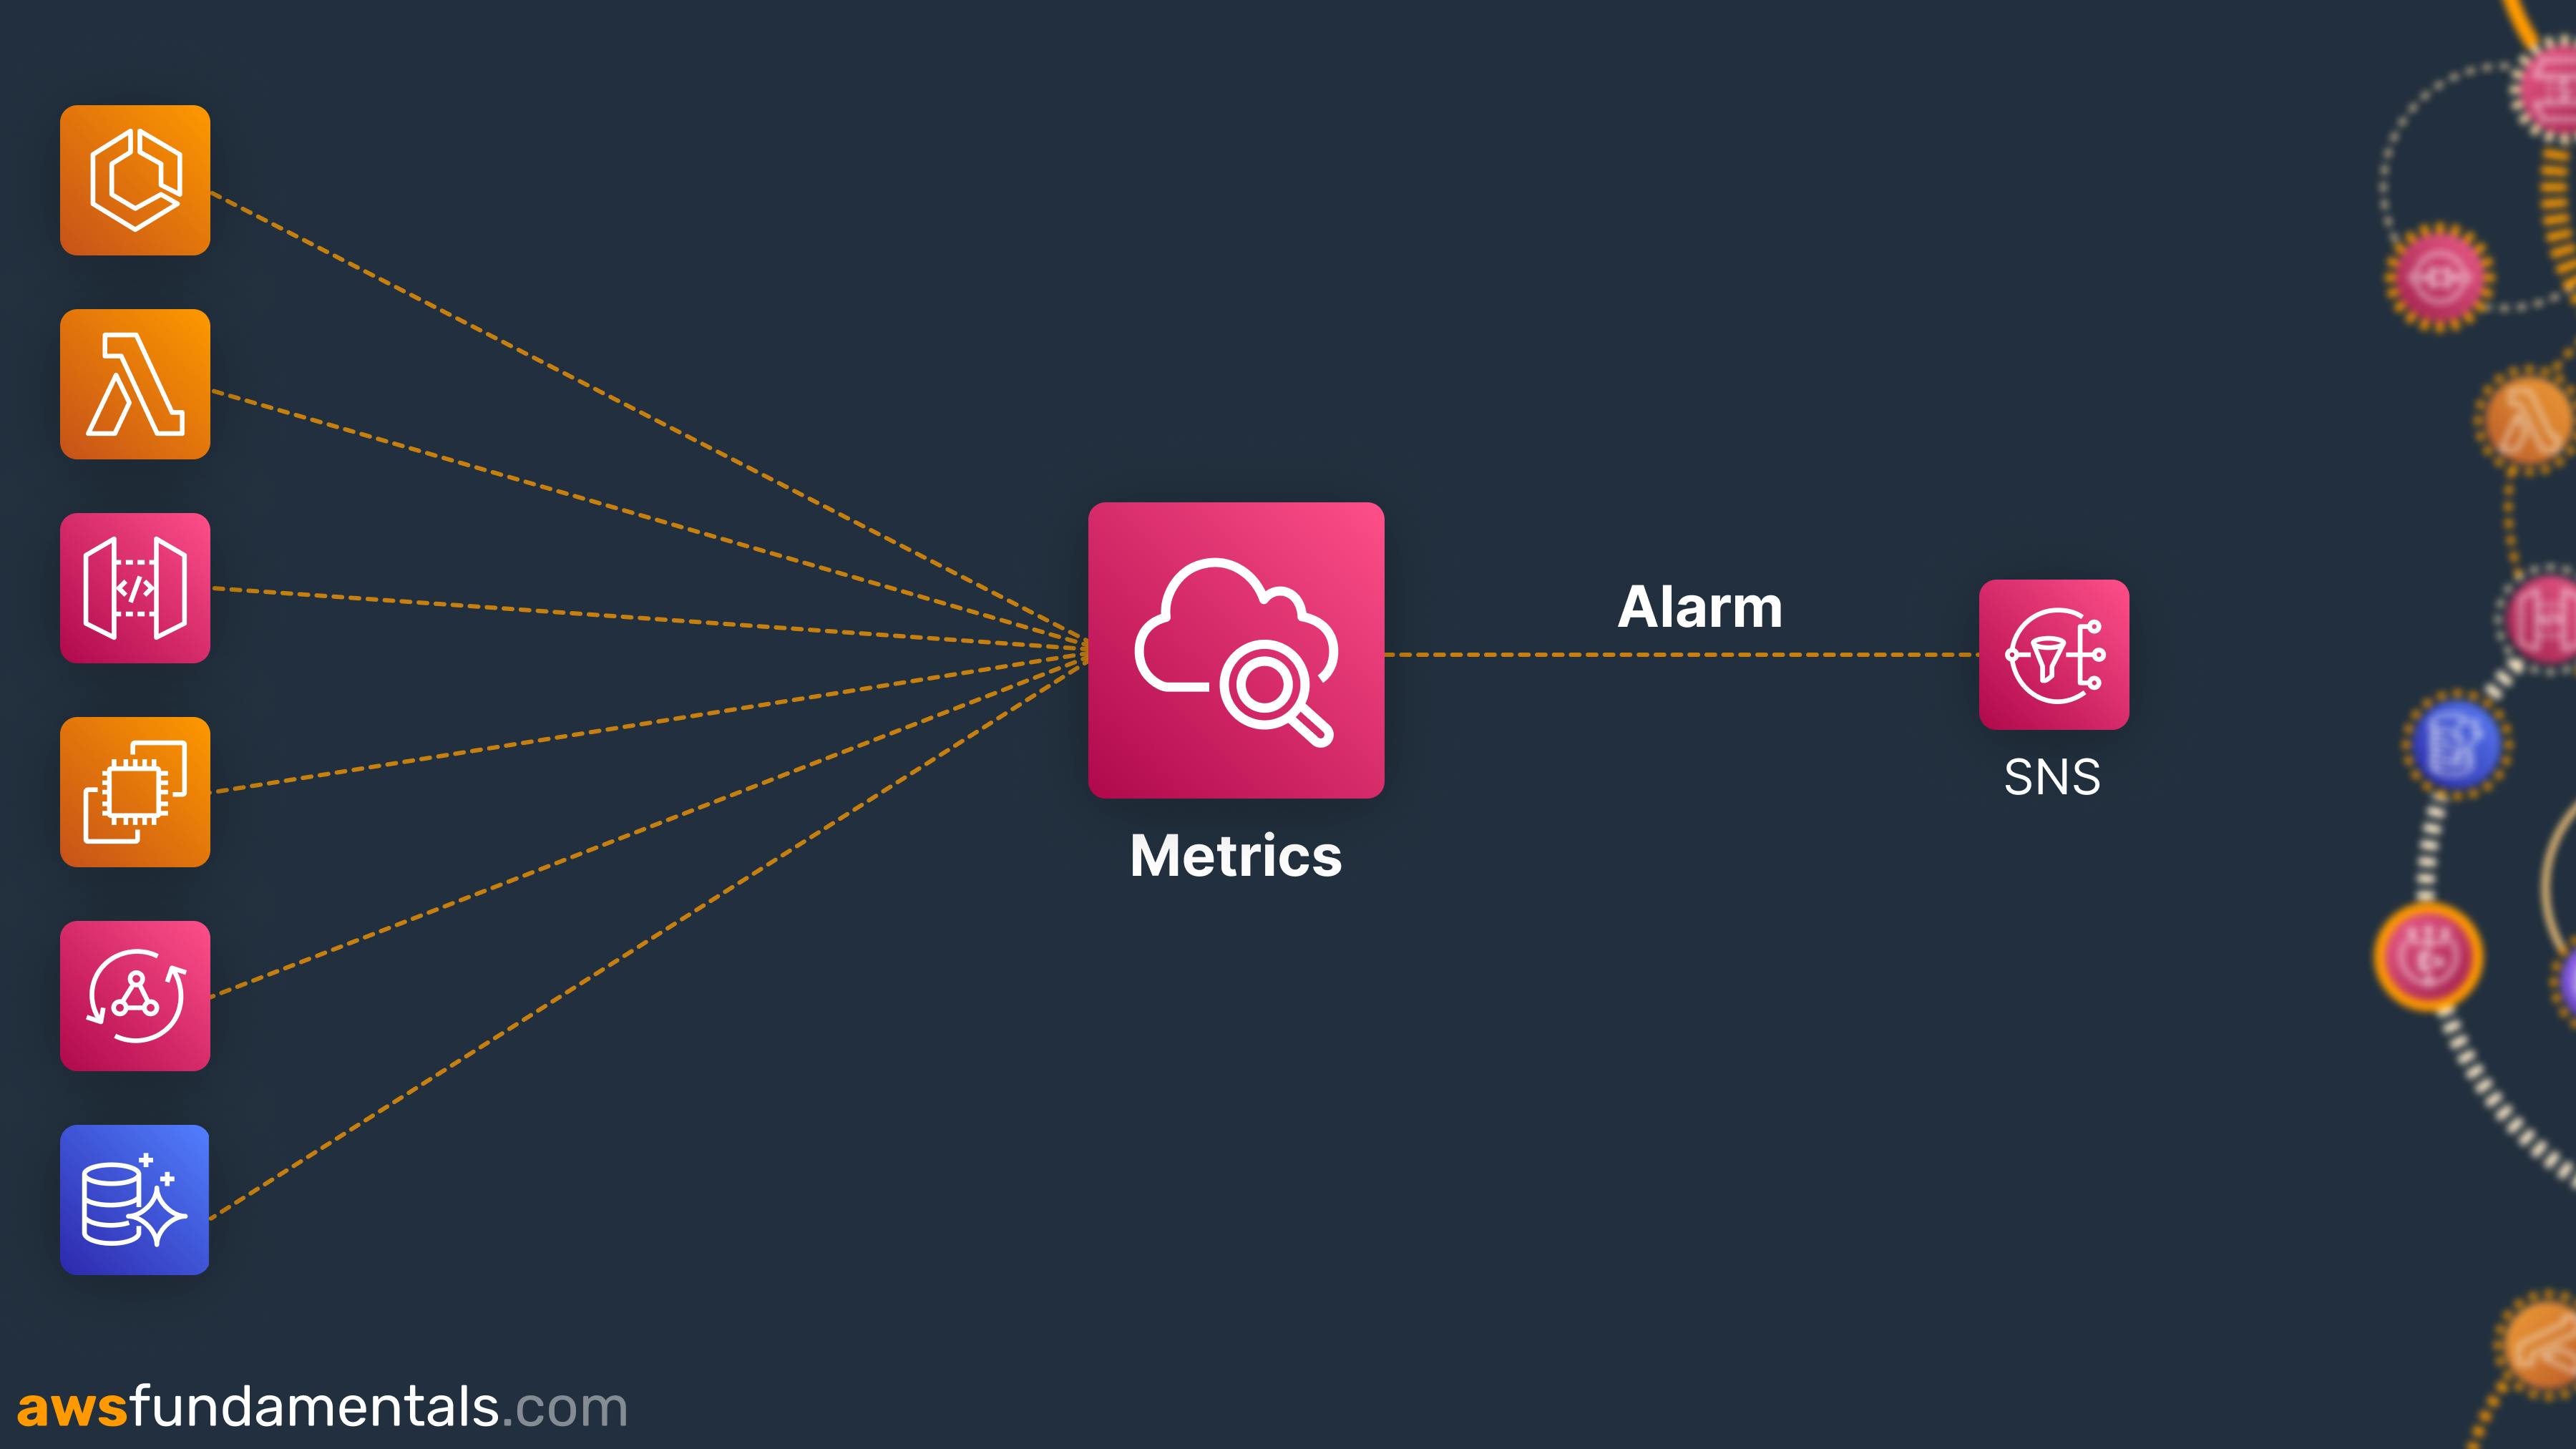
Based on the metrics you can also create alarms. Alarms notify you if a metric meets a pre-defined threshold. CloudWatch Metrics lets you even scale your resources. For example, if an EC2 instance is almost out of memory you can scale it with CloudWatch.
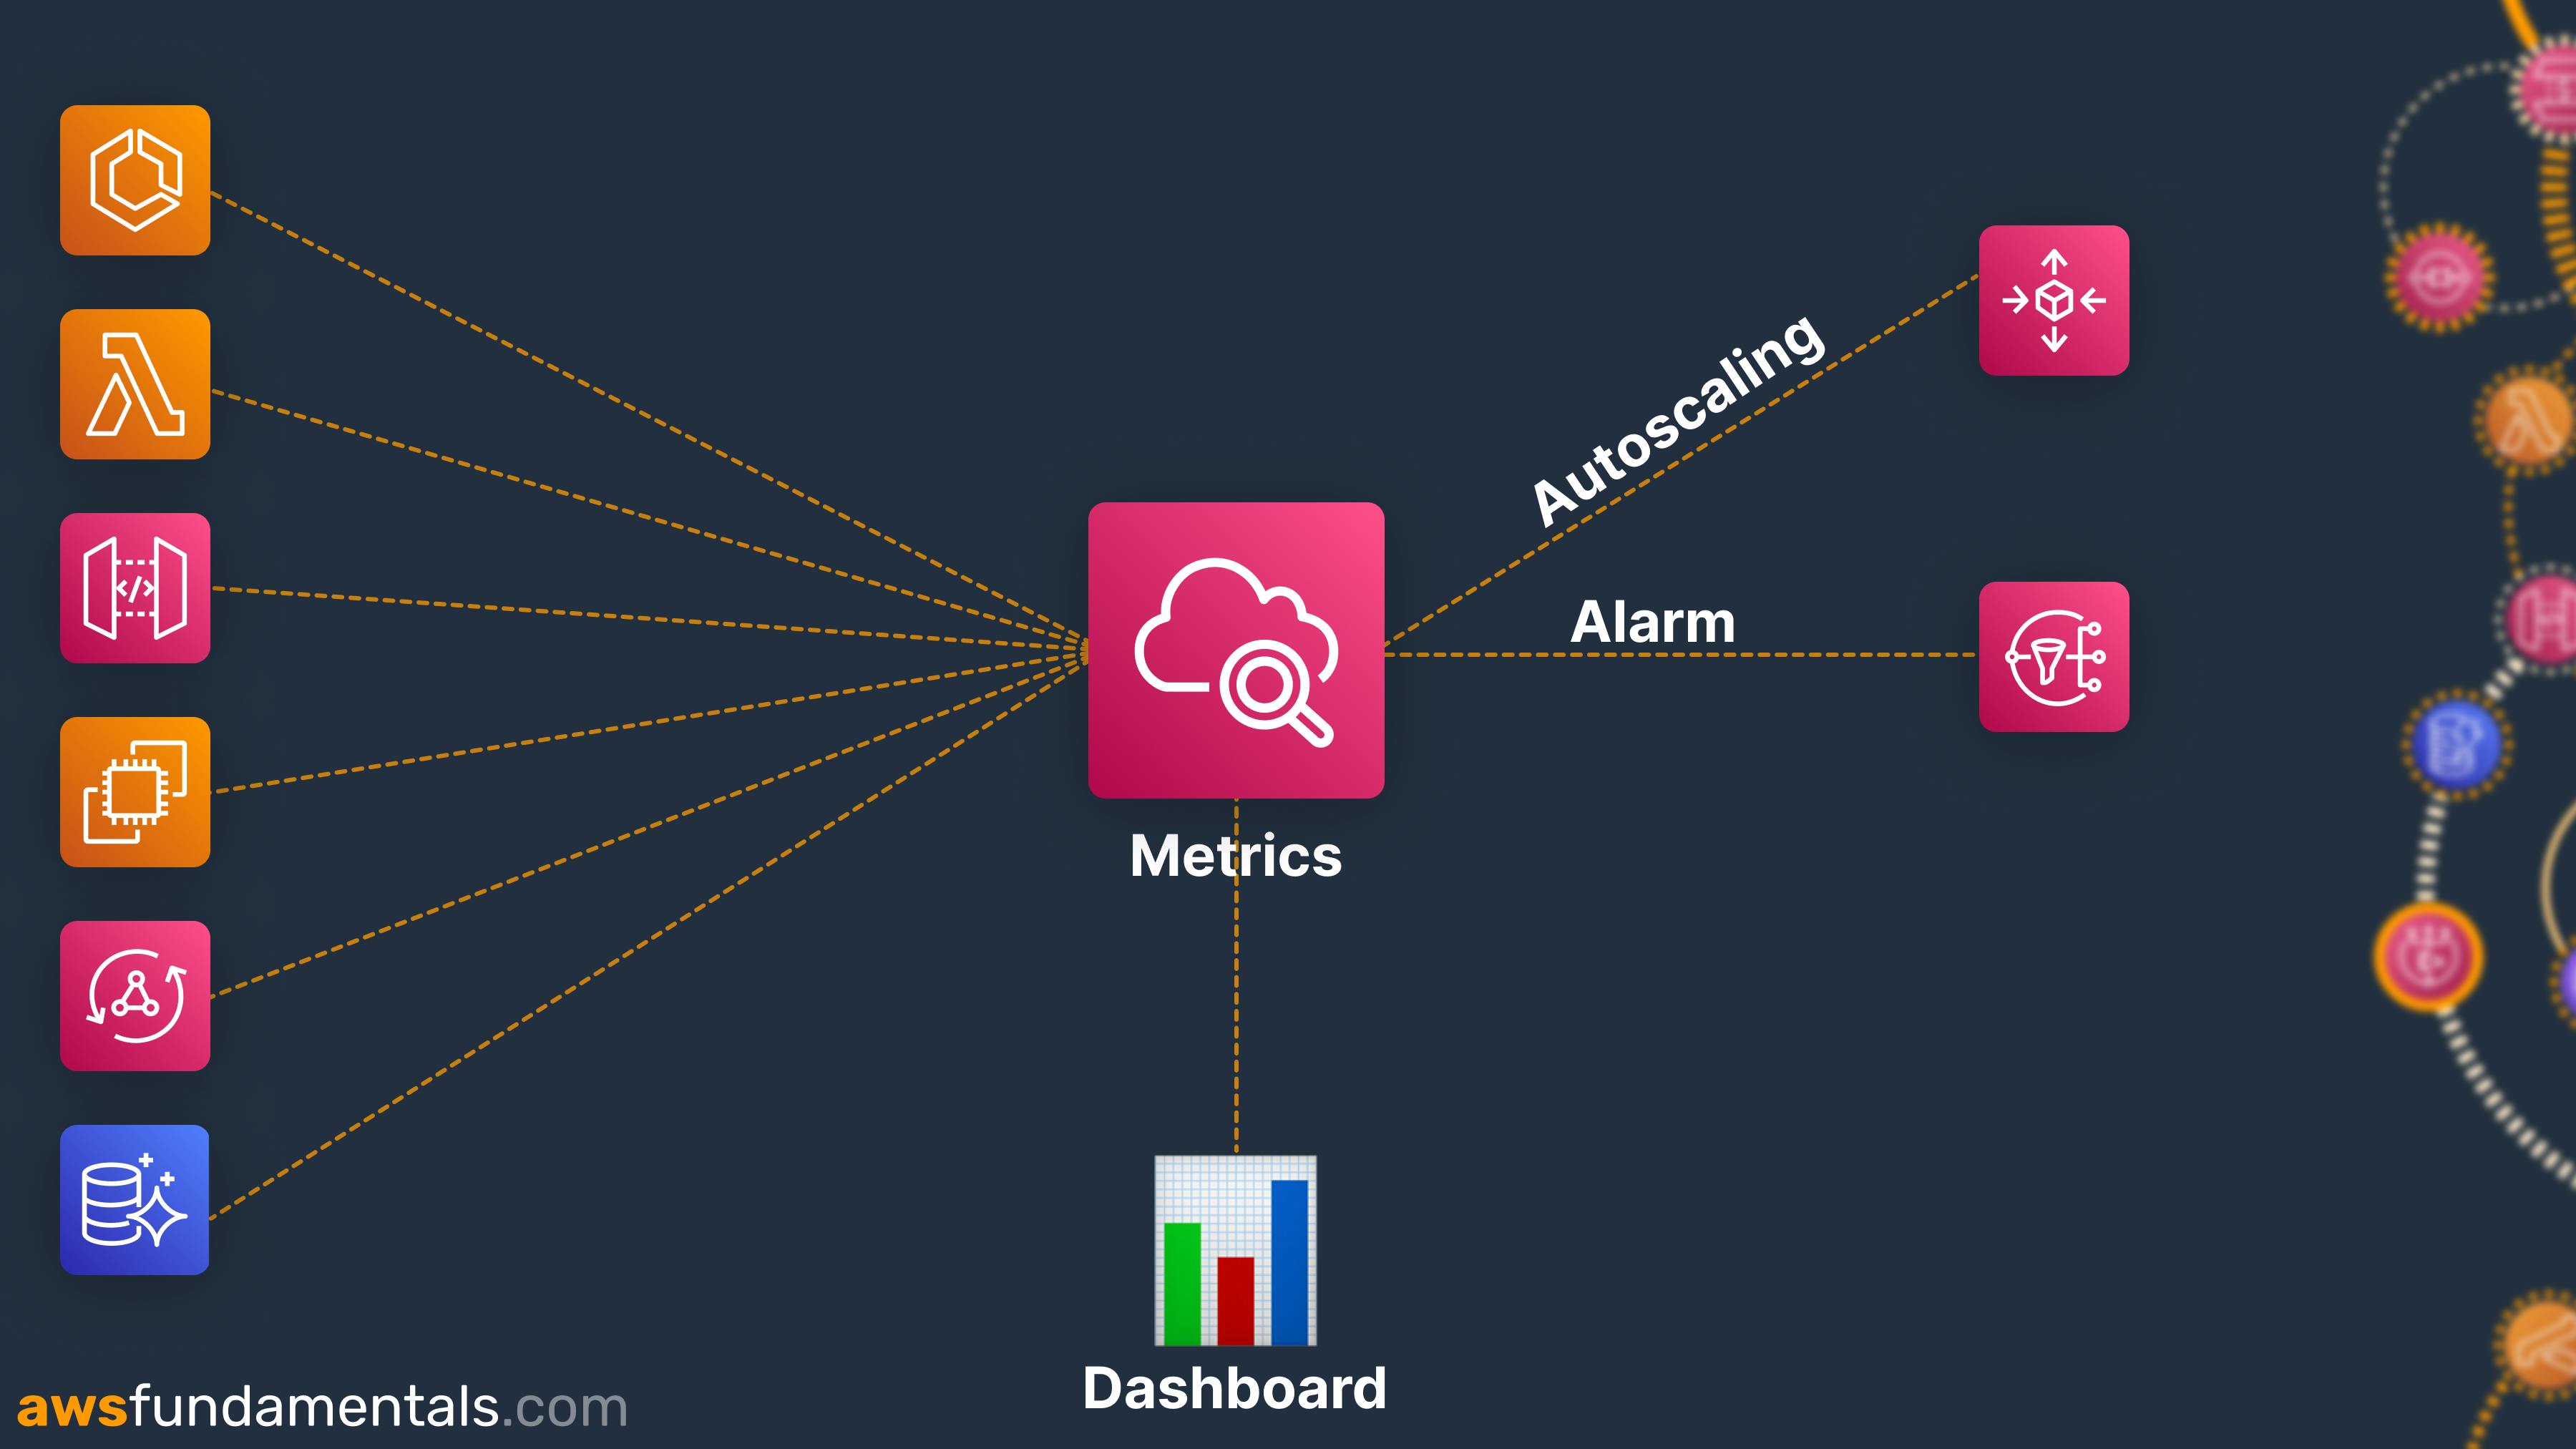
This image shows you how CloudWatch metrics work. You have several services that put metrics into CloudWatch metrics. A CloudWatch alarm either uses SNS or Autoscaling as an action. SNS for notifying you and your colleagues. AutoScaling for scaling resources up and down.
Concepts of CloudWatch Metrics
| Name | Definition |
| Namespaces | A namespace is like a bucket for CloudWatch metrics. The same namespaces belong to each other and different namespaces don’t. Typically the AWS namespace follows the convention AWS/service for example AWS/EC2 or AWS/Lambda |
| Metrics | A metric is time-ordered data within CloudWatch. It represents a set of data points. A metric has a time and a data point attached. If you think of the AWS Lambda service you can have the 23rd of August as a Date and the number of errors (0) as the data point. |
| Dimensions | Dimensions are name/value pairs for the identity of a metric. Dimensions make it easier to understand metrics. For Lambda these dimensions can be for example by function name or across all functions. It is a way of grouping metrics together. |
| Resolution | Metrics can have different resolutions. Resolutions are the granularity of the metrics. The standard resolution has a granularity of one minute. High Resolution has a granularity of one second. You often need to pay extra charges to get the high resolution. |
| Statistics | Statistics are aggregations of the metrics over a specified time. For example, a sum of errors overall Lambda functions. |
The following image shows an example of a Lambda metric.
Namespace:
/AWS/lambdaMetrics:
InvocationsDimension:
byFunctionName: SubscriptionHandler
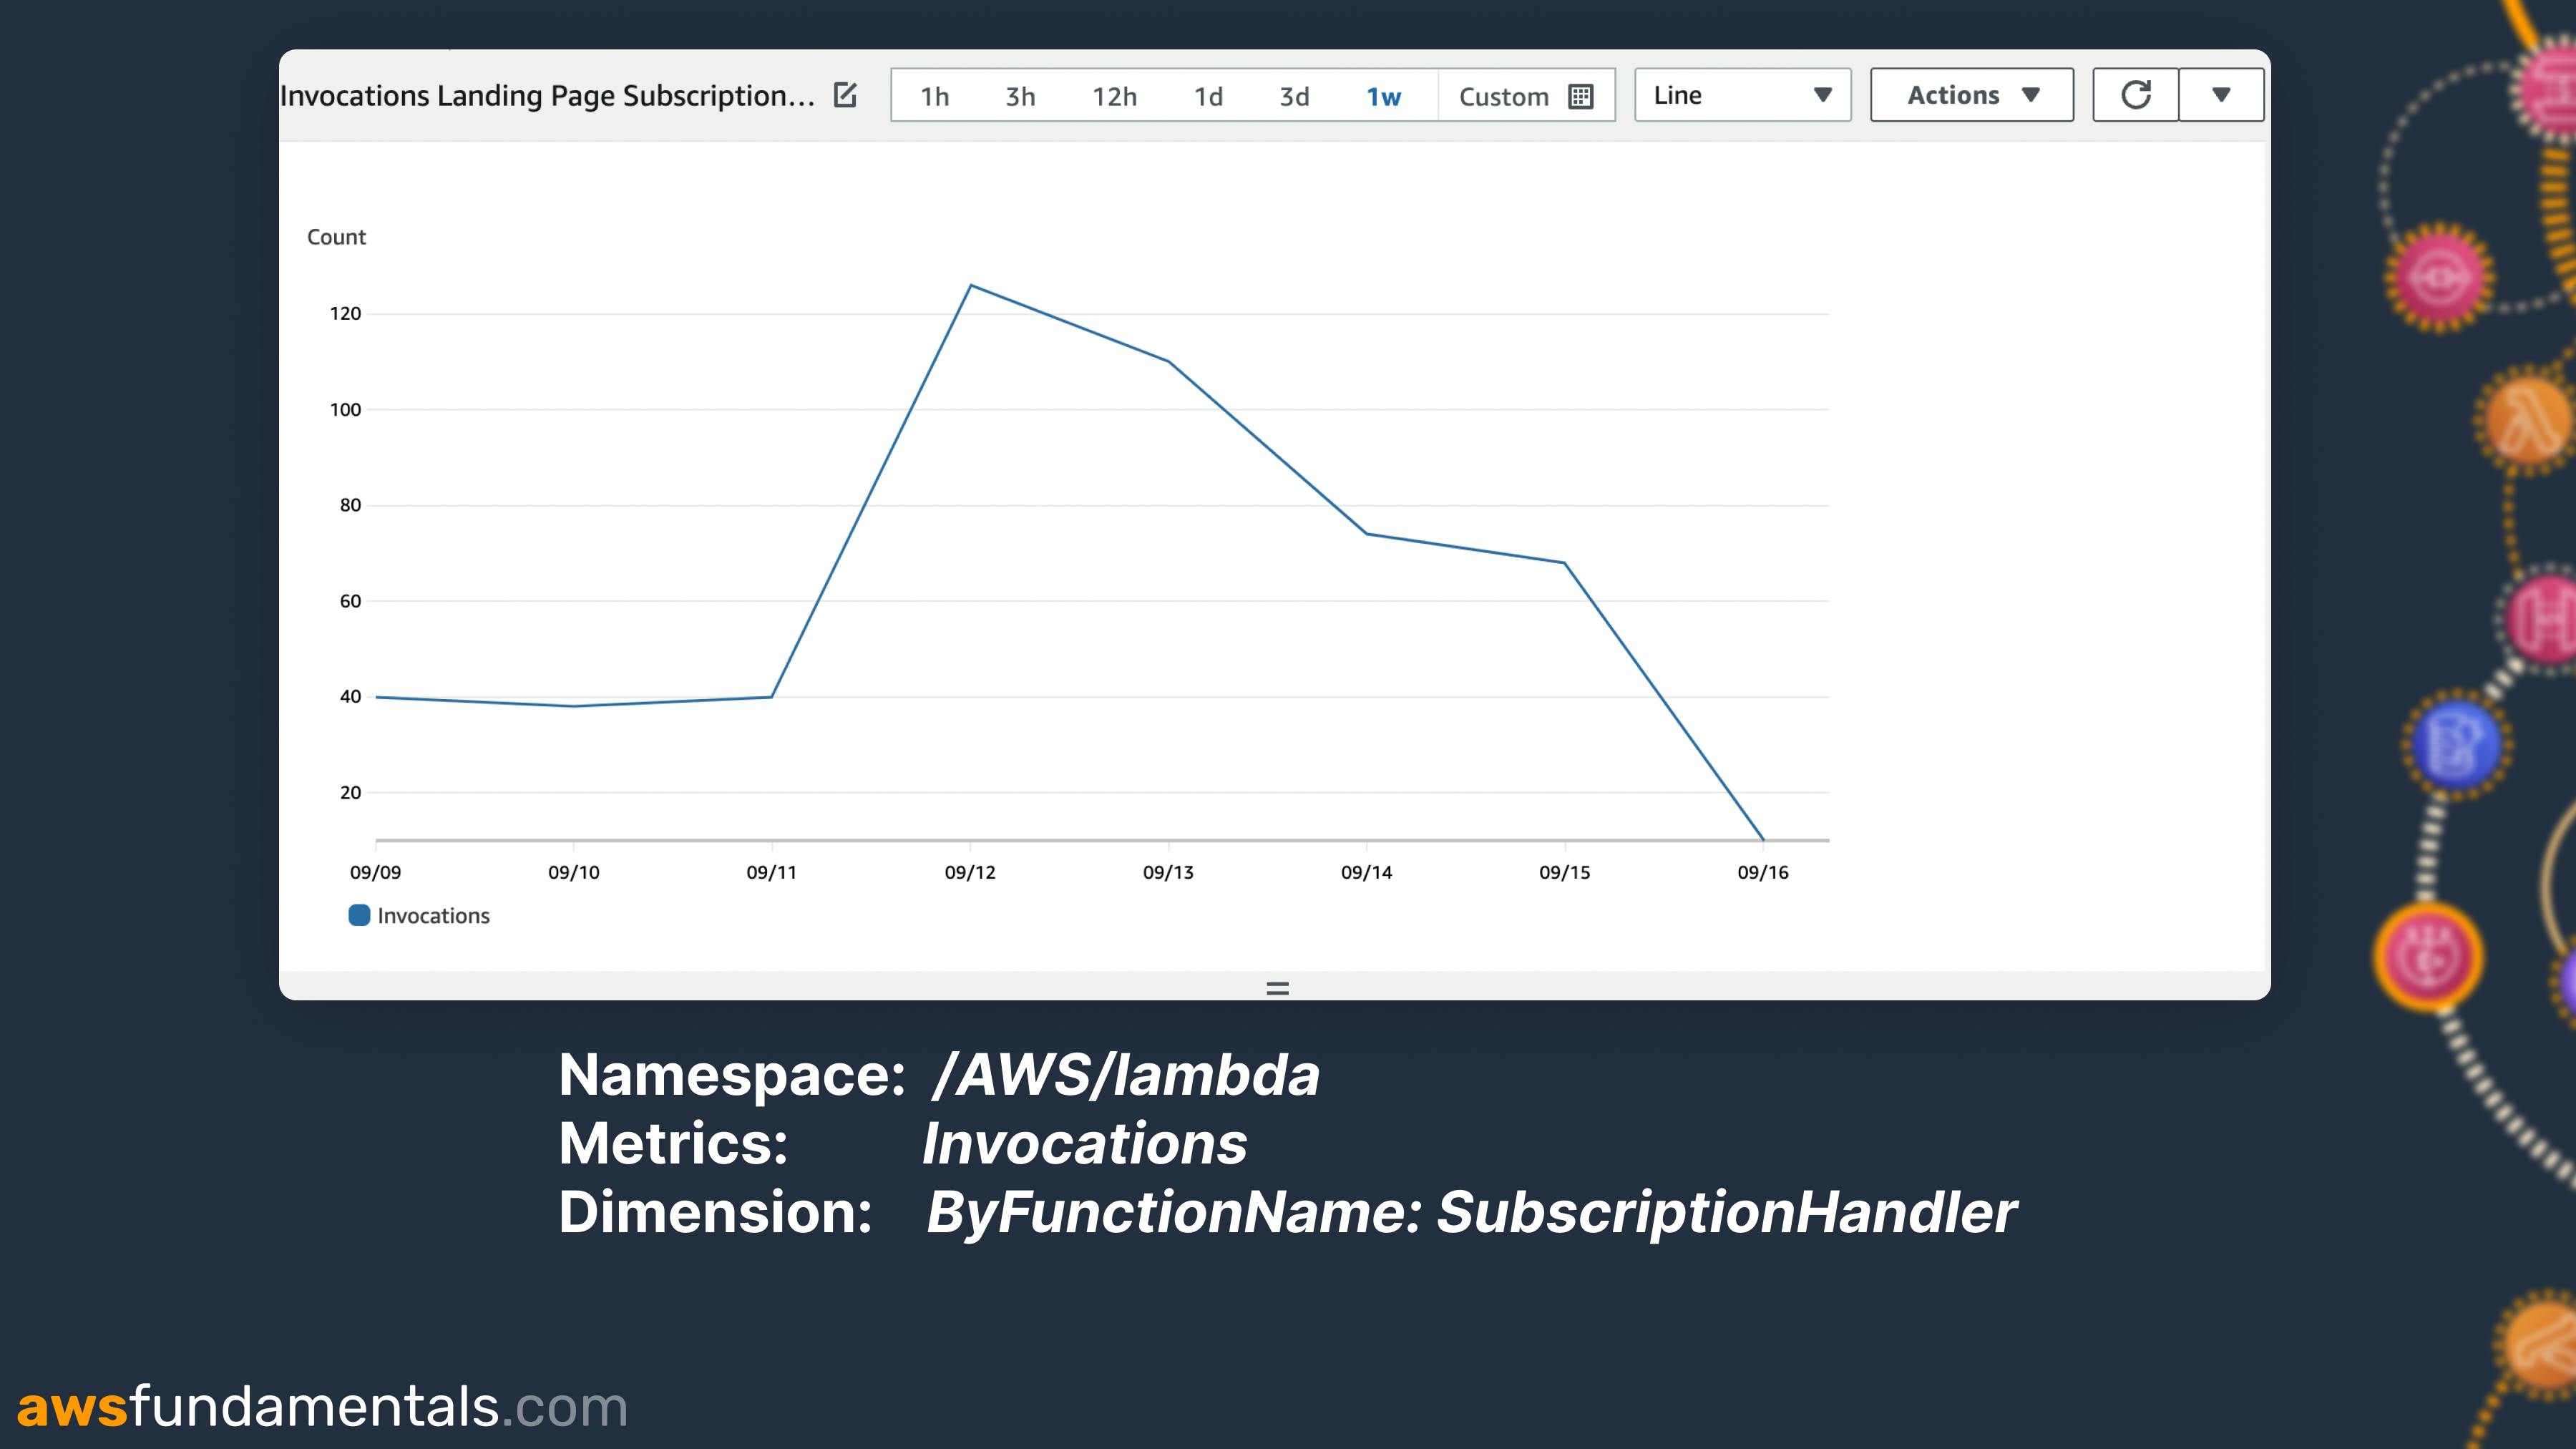
It displays the number of invocations over one week per day.
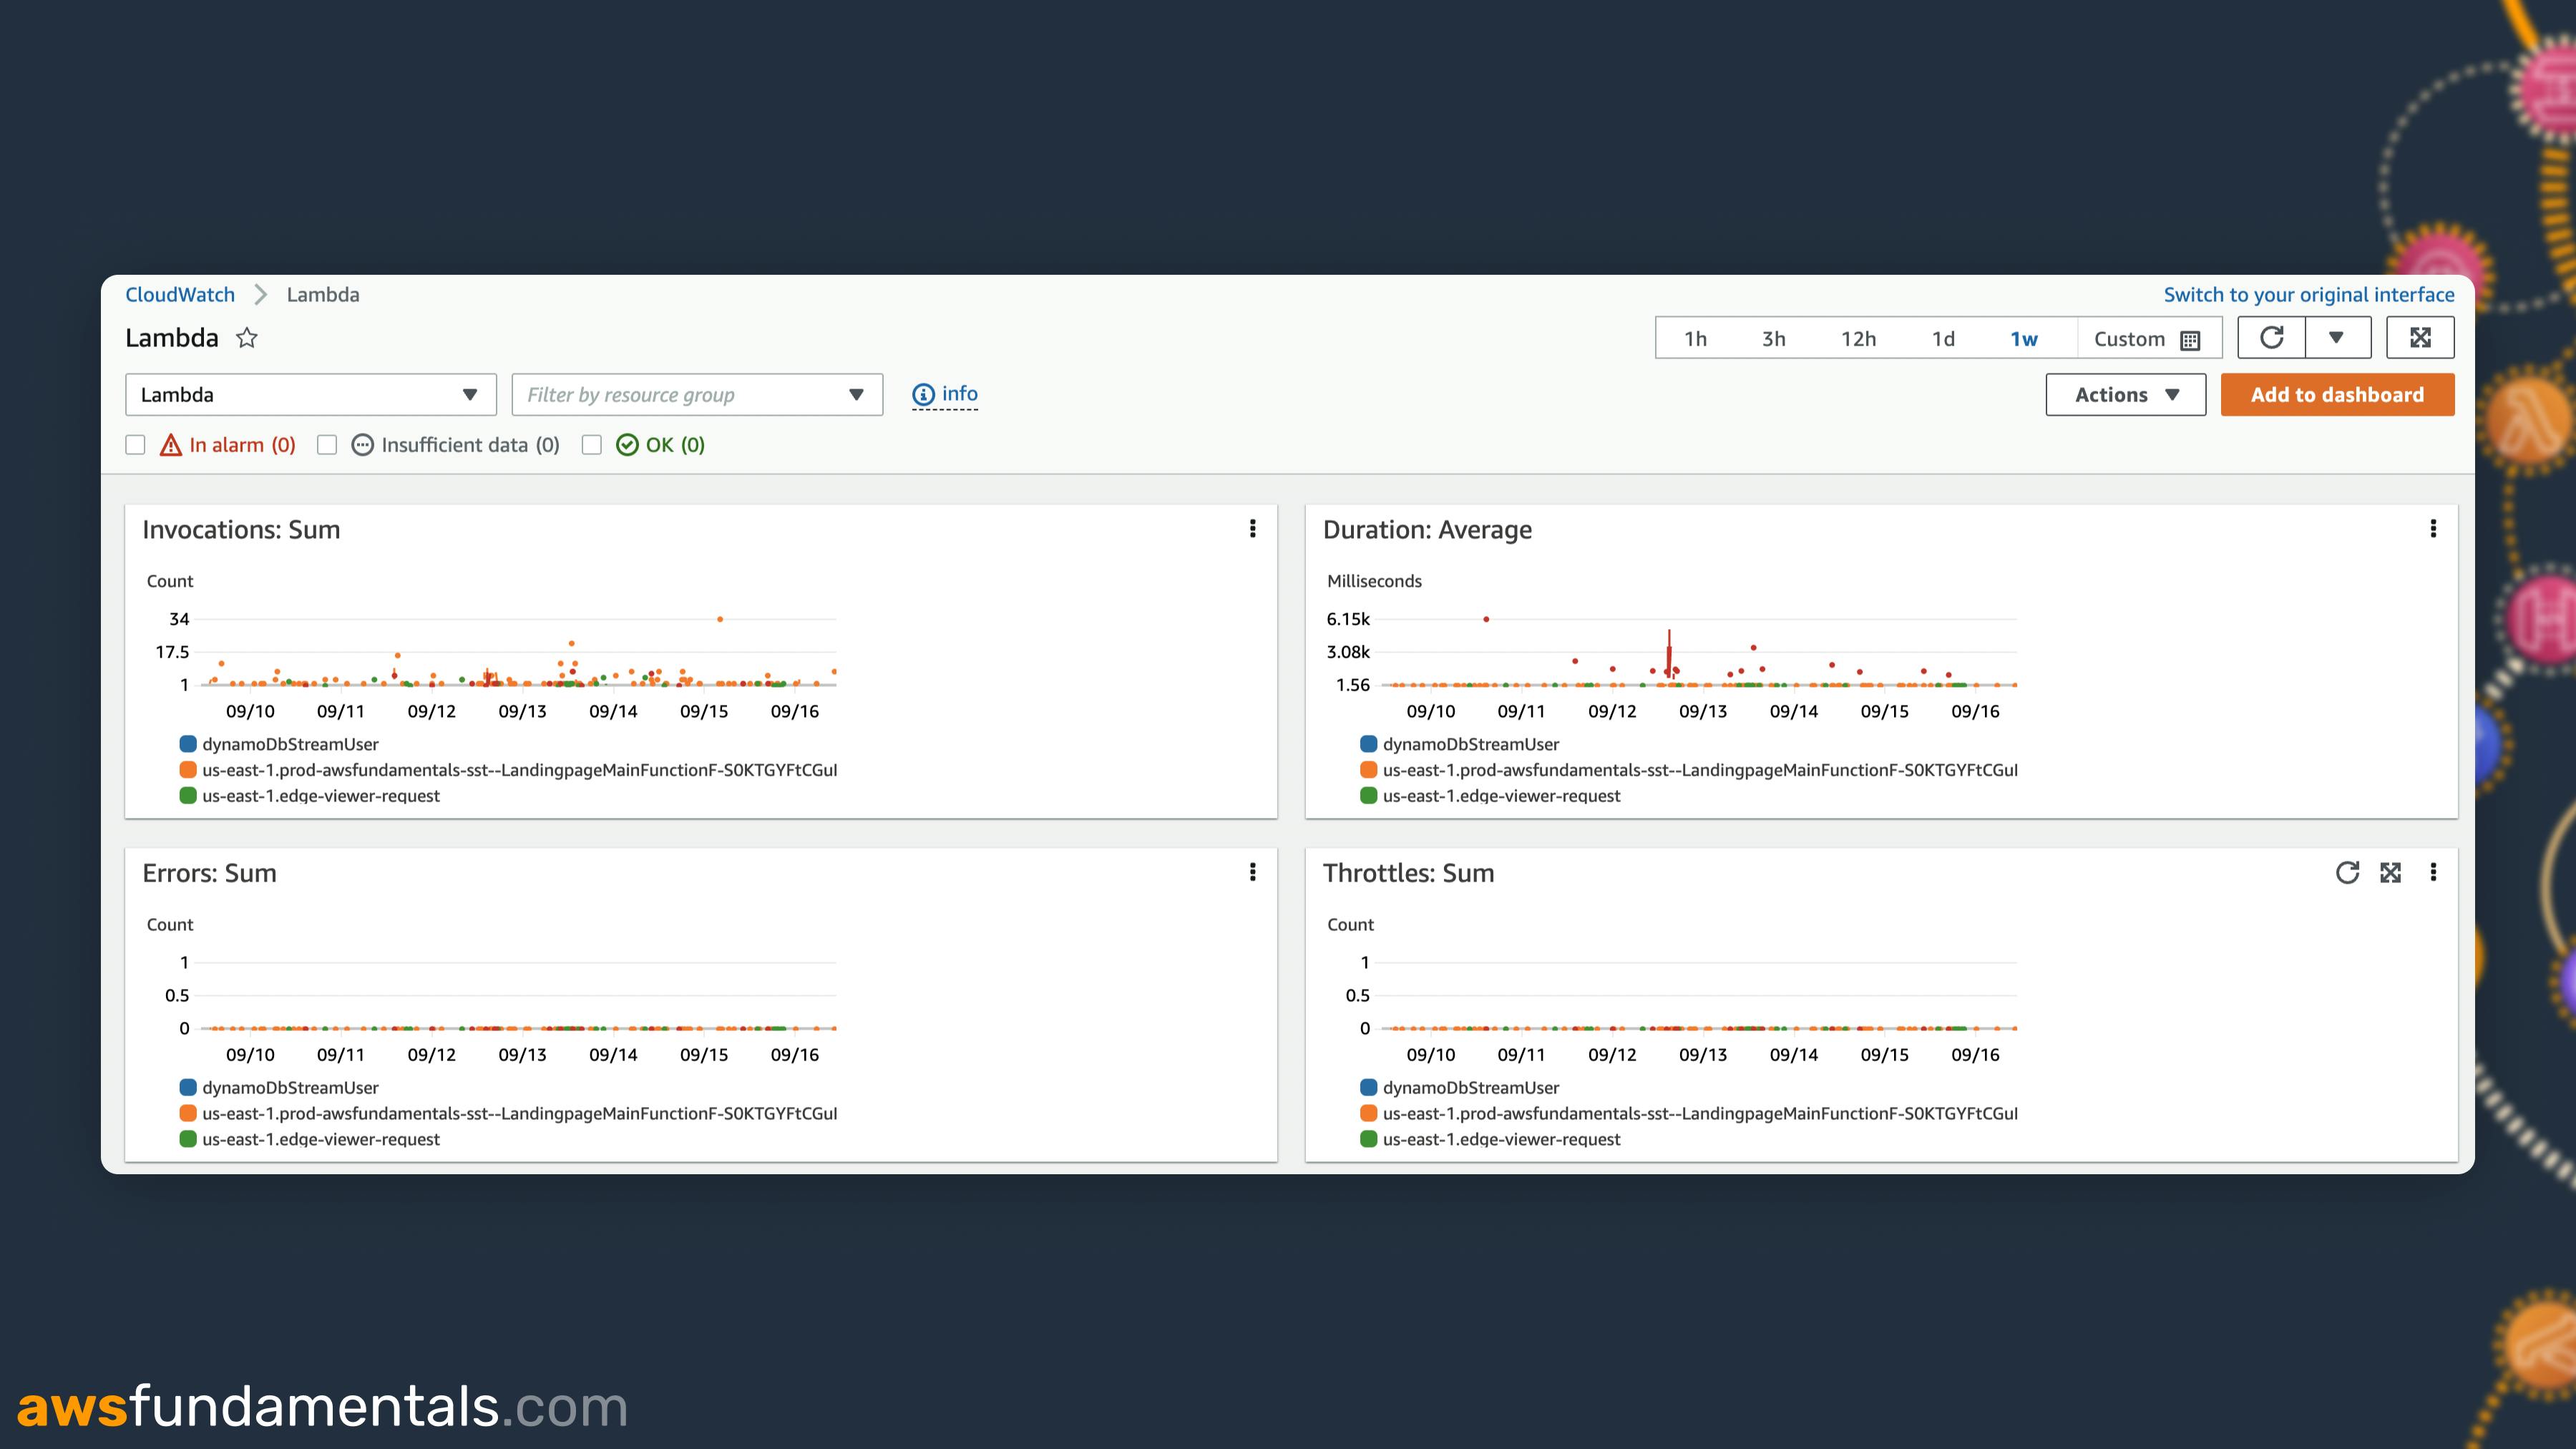
CloudWatch Metrics Example for Lambda
The CloudWatch console gives you several opportunities to look at your metrics.
Let’s see an example. Click on CloudWatch Metrics and you’ll see this window:
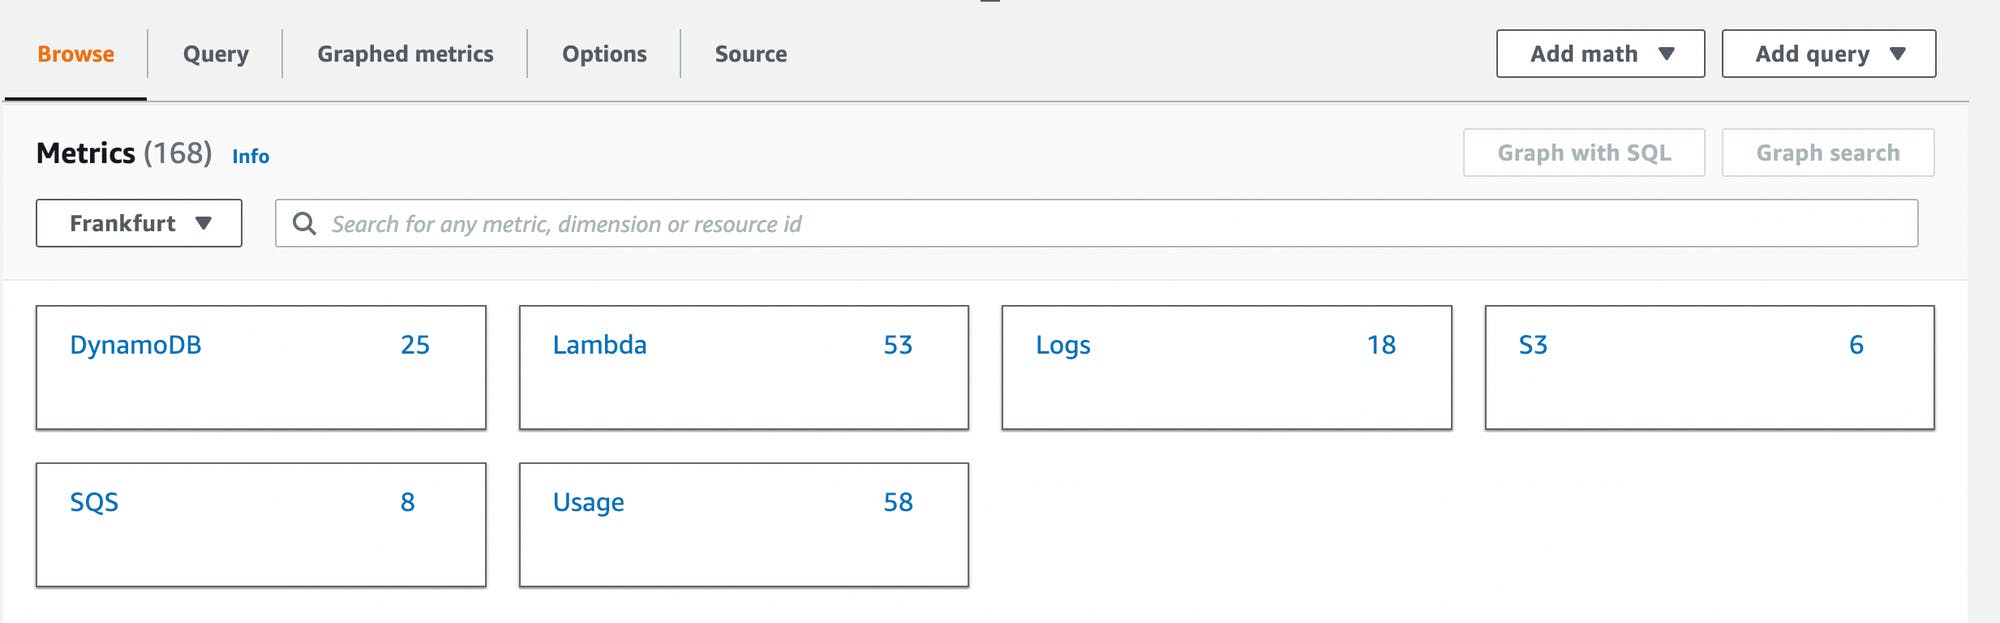
In the Browse tab, you can see all the different services that have metrics available. You can click on the service (e.g. Lambda) to see all dimensions.
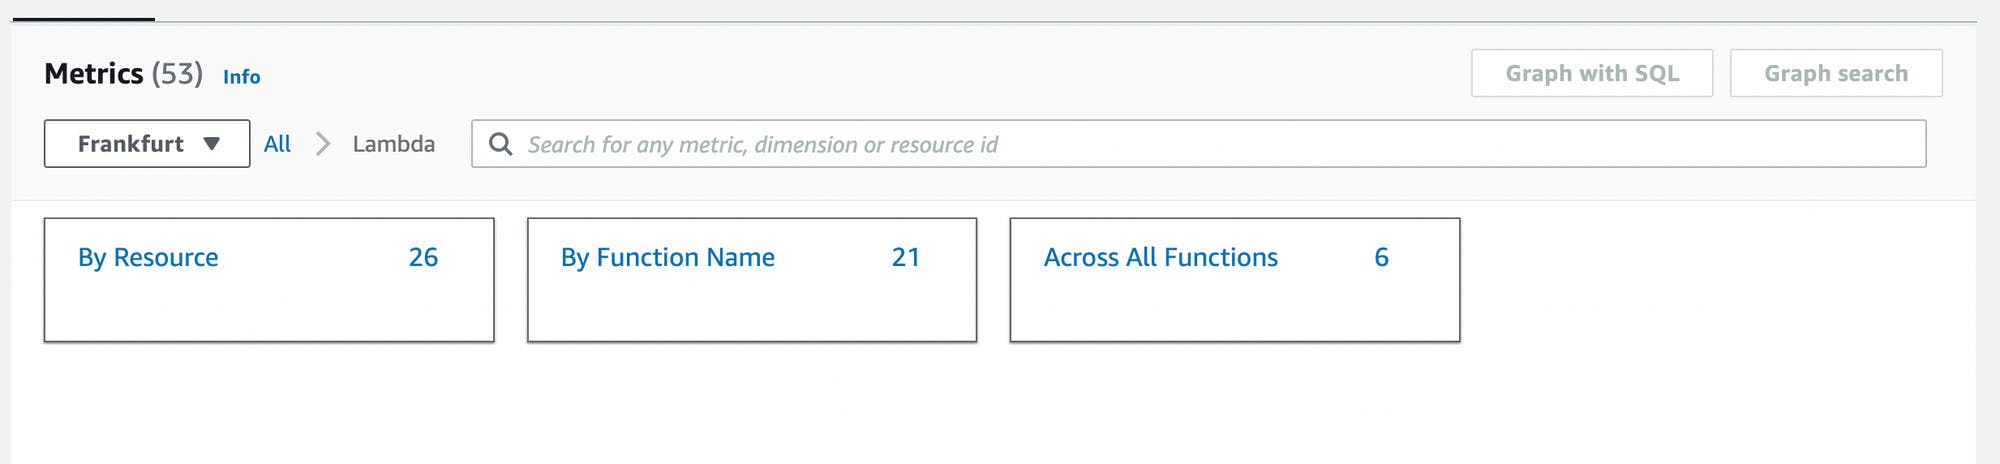
Dimensions here are
By Resource
By Function Name
Across All Functions
We choose Across All Functions because we want to see metrics across all our Lambda functions.
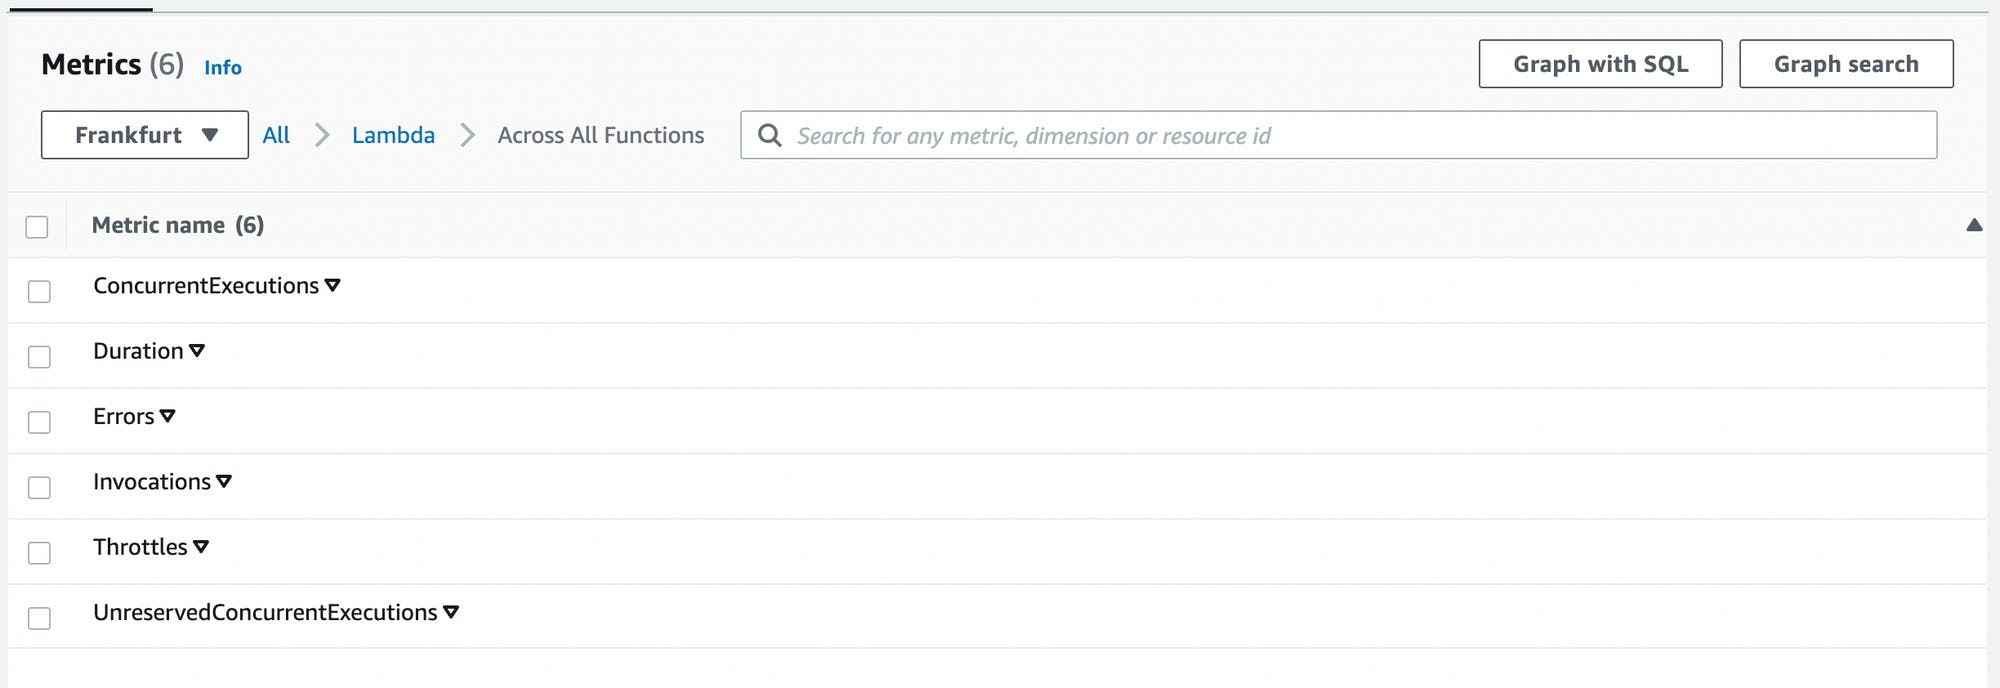
Now, you see the different metrics available for Lambda. These are
ConcurrentExecutions: How many Lambda functions run at the same timeDuration: How long did the functions runErrors: How many errors happenedInvocations: How often was the Lambda executedany many more
If you check one of the metrics you will see a graph. Let's check the Invocations metric.
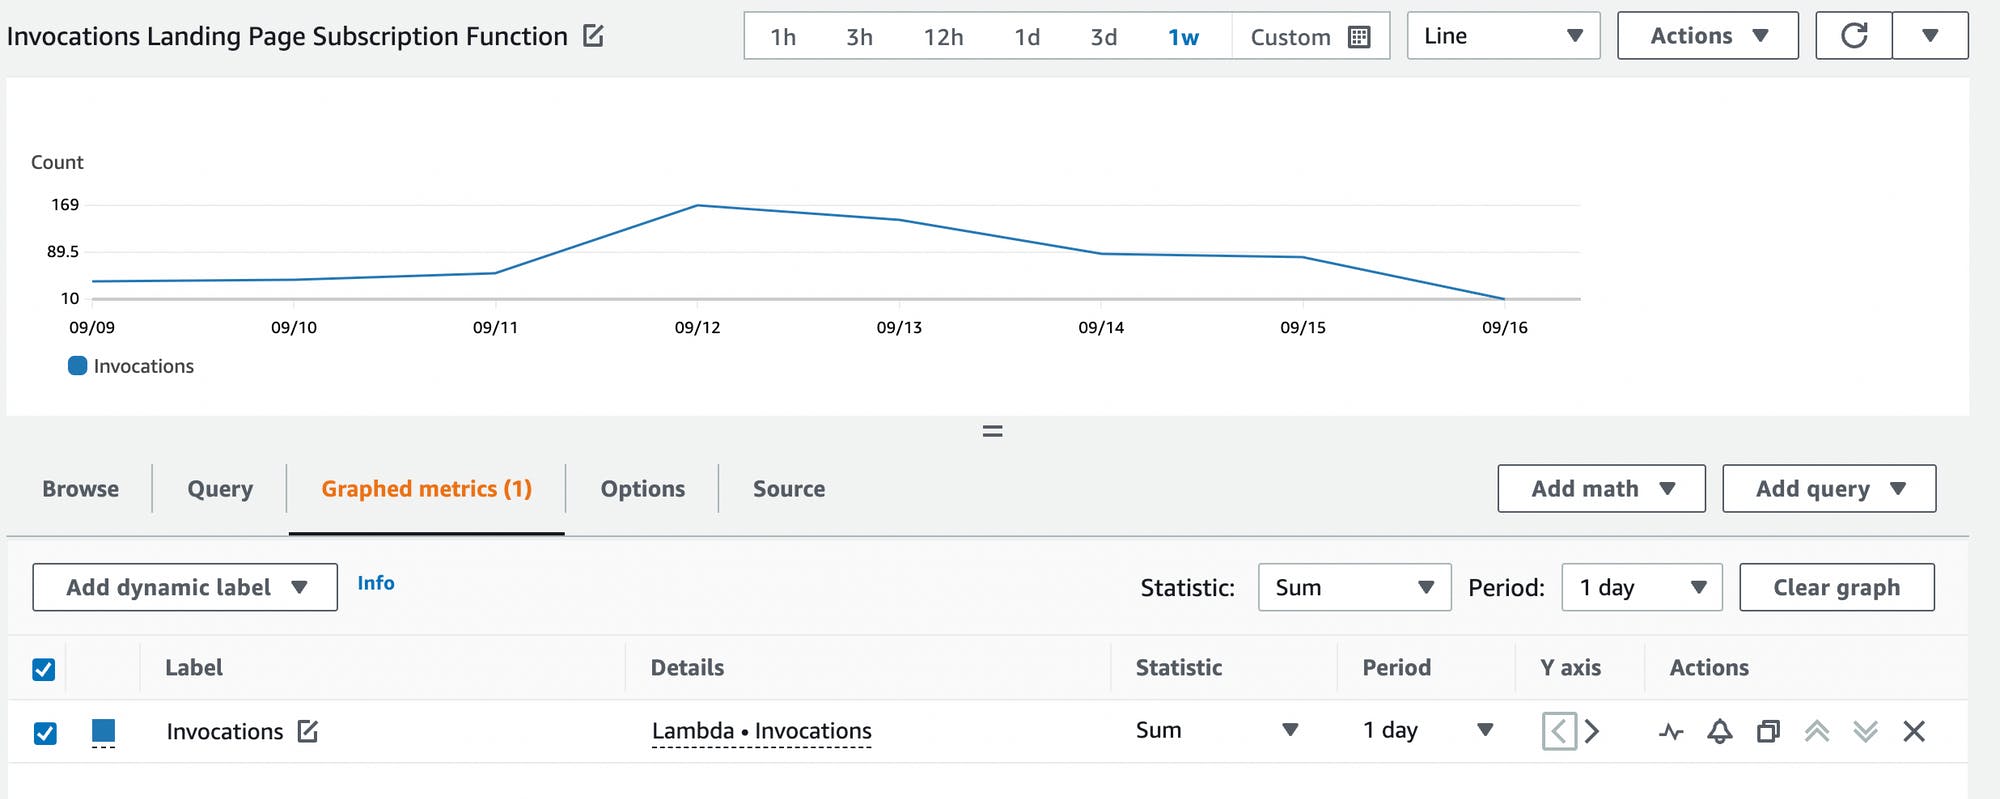
This is how you can display multiple metrics for all of your services.
Standard vs. Granural Metrics
Metrics are available in two different granularities. The standard one is a one-minute interval. You can also create high-resolution metrics which are available in one-second intervals. Be aware: High-Resolution metrics are more expensive.
CloudWatch Dashboard
You can create a dashboard based on Logs and Metrics. With Dashboards, you can get an overview of how your system behaves. It is also possible to easily share your dashboards with other teams or stakeholders.
CloudWatch also creates automatic dashboards for you. Head over to CloudWatch -> Dashboards and check them out. They are available for some services like
DynamoDB
API Gateway
Lambda
CloudWatch Alarms
CloudWatch Alarms combine the usage of CloudWatch Logs and CloudWatch Metrics. You can define thresholds when an alarm should be in the state IN_ALARM and notify you.
A common example with Lambda is the number of errors in your Lambda function. For example, you can set it to 5 errors over a period of 1 minute. If this threshold is met CloudWatch will automatically notify you.
Other good examples of alarms are:
Messages available in your Dead Letter Queue
500 errors in your API
High latency in your API
Alarm States
An alarm can be in two different alarm states.
IN_ALARM: Your alarm is onOK: The alarm is not active, everything is good
It is also possible that the alarm doesn’t have sufficient data. You can define if this will trigger the alarm or not.
Metric Alarms vs. Composite Alarms
There are two different types of alarms, metric alarms, and composite alarms.
Metric Alarm: This alarm is based on one metric.
Composite Alarm: This alarm takes several alarms and combines them. For example, you can only send an alarm if API Gateway has more than 3 500 errors and your Lambda function throws more than 3 errors within one minute.
SNS is used for Notifications
Once an alarm switches to the state IN_ALARM, SNS is used to trigger a notification.
With SNS you can send notifications in many different ways:
E-Mail
SMS
PagerDuty
Lambda Function
By integrating Lambda functions you can build your custom alarm and incident logic.
Creating CloudWatch Alarms
Let's see how to create a CloudWatch Alarm.
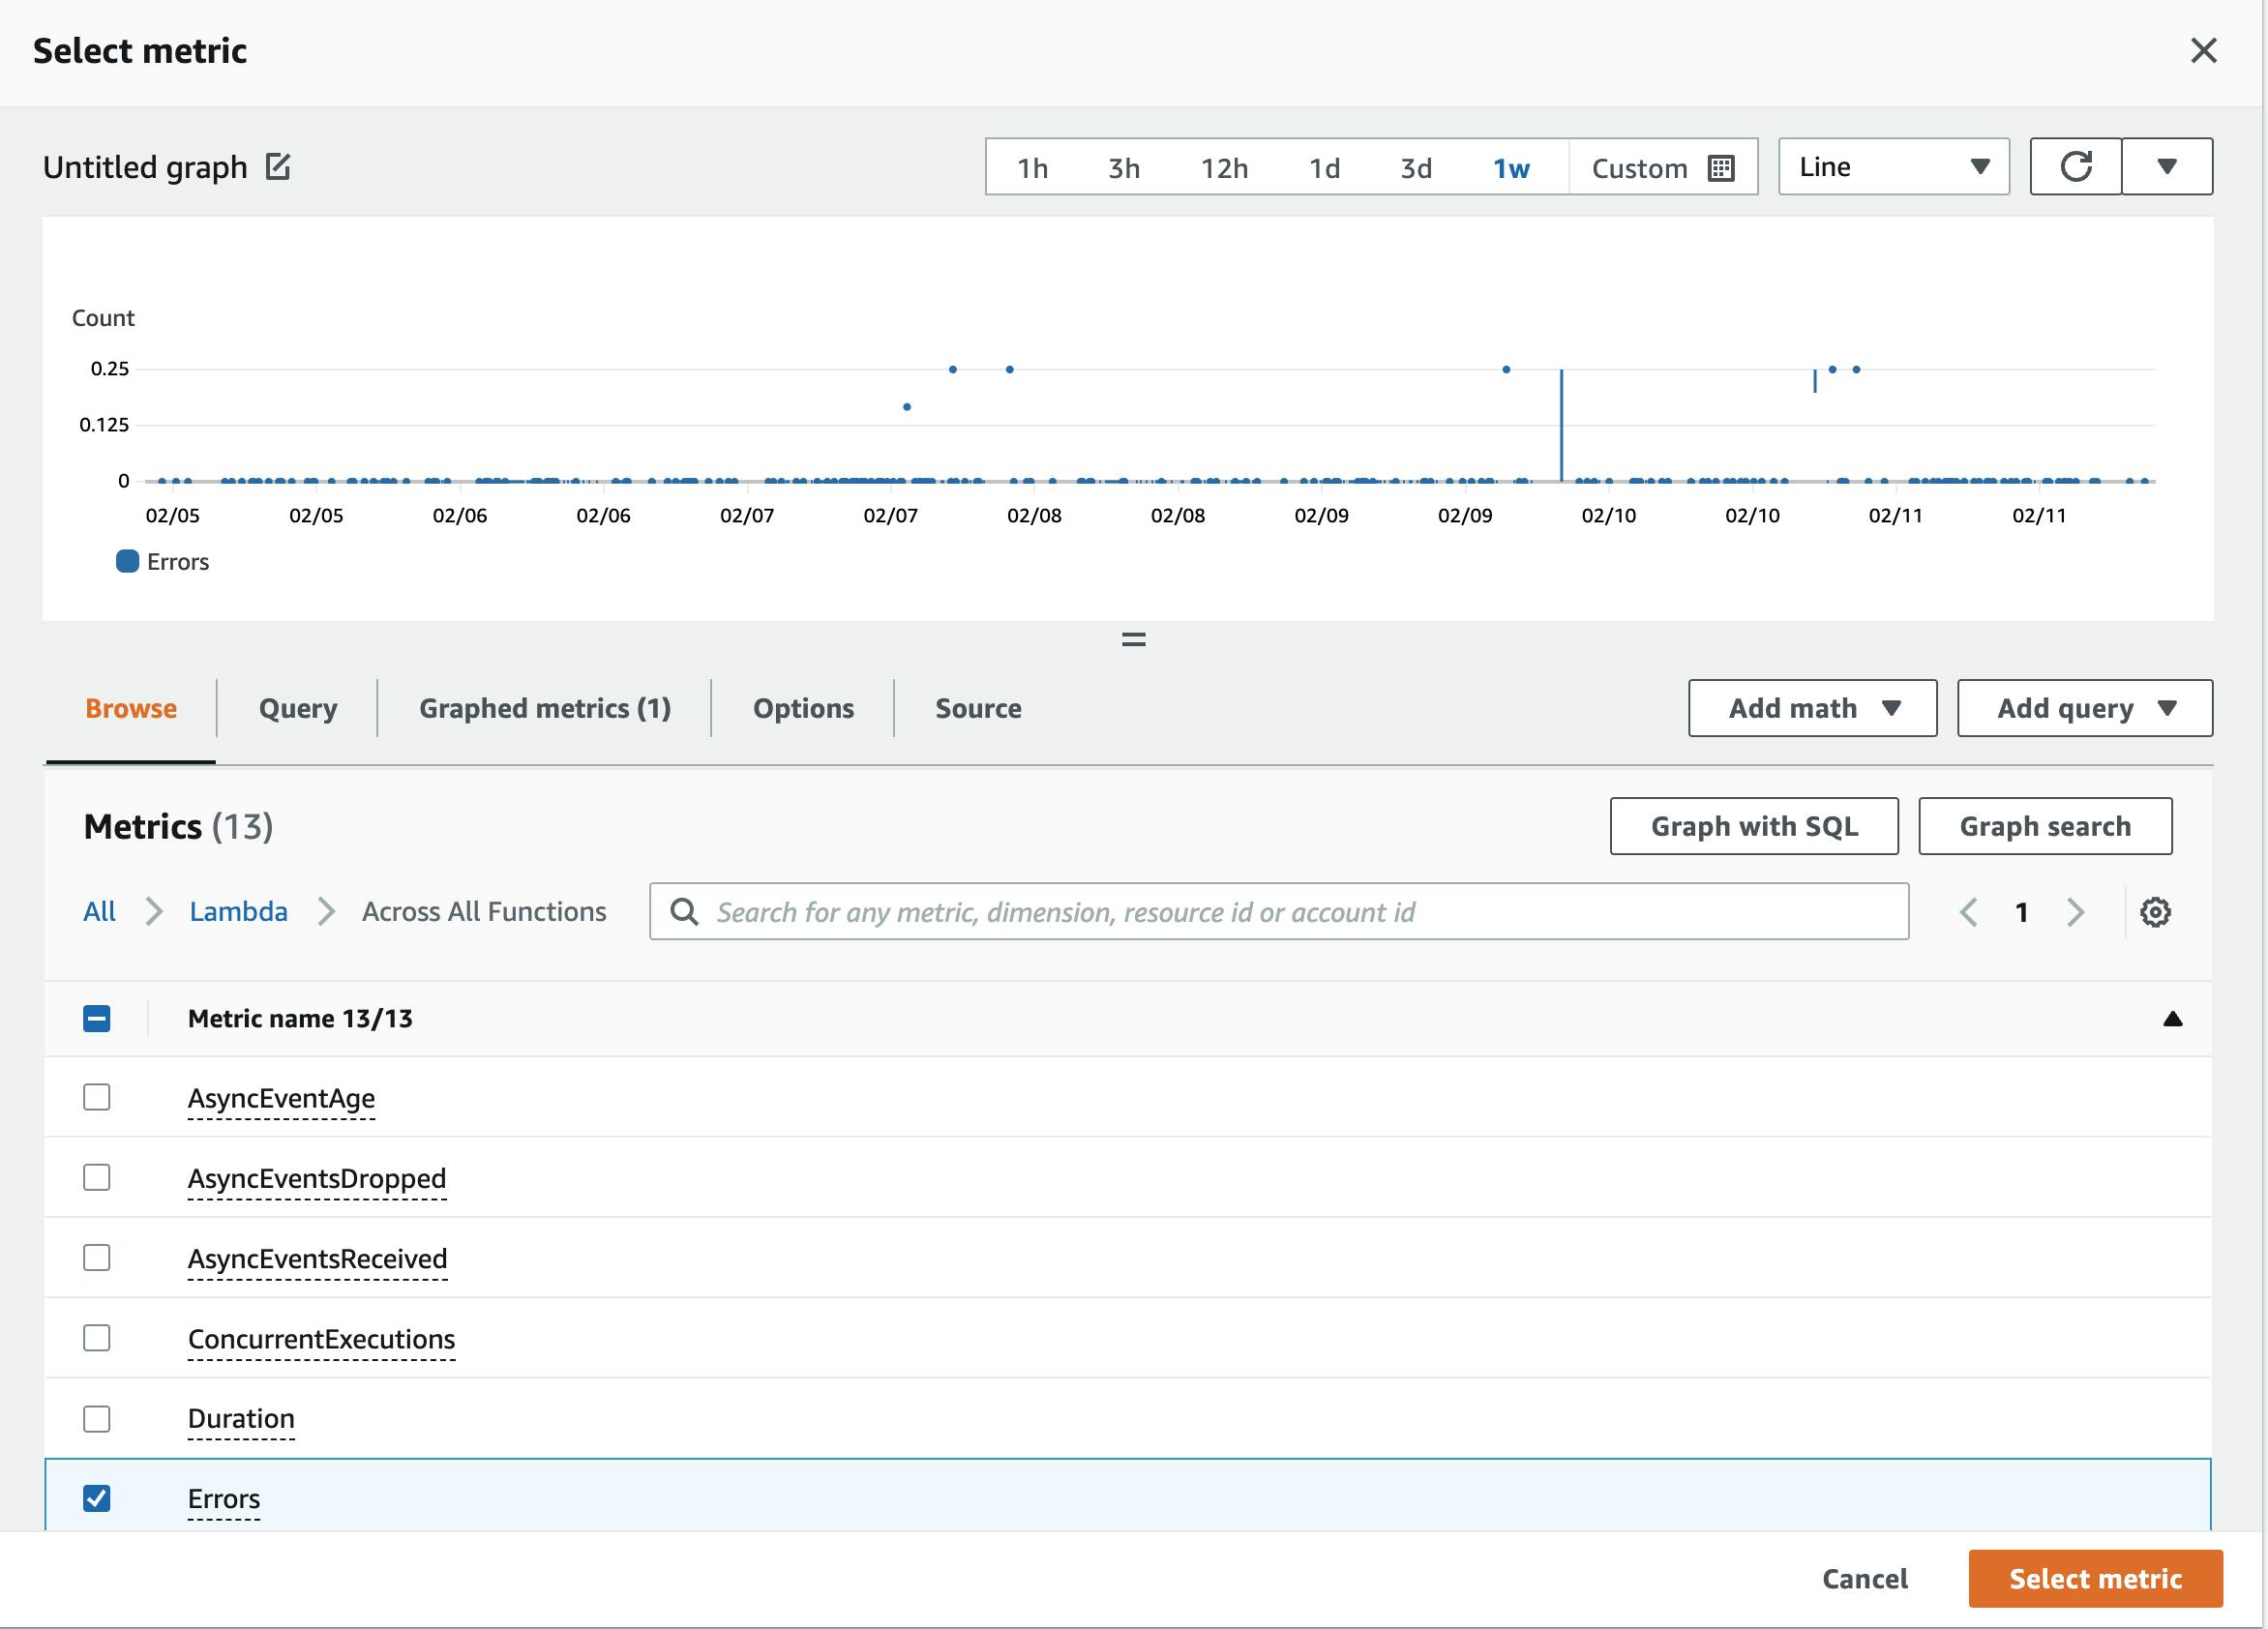
Selecting a Metric
First, let's select a metric. We are interested in the number of errors across all Lambda Functions.

Once you click on Select Metric you can see the Metrics Explorer. Go to Lambda -> Across All Functions and check the metric errors.
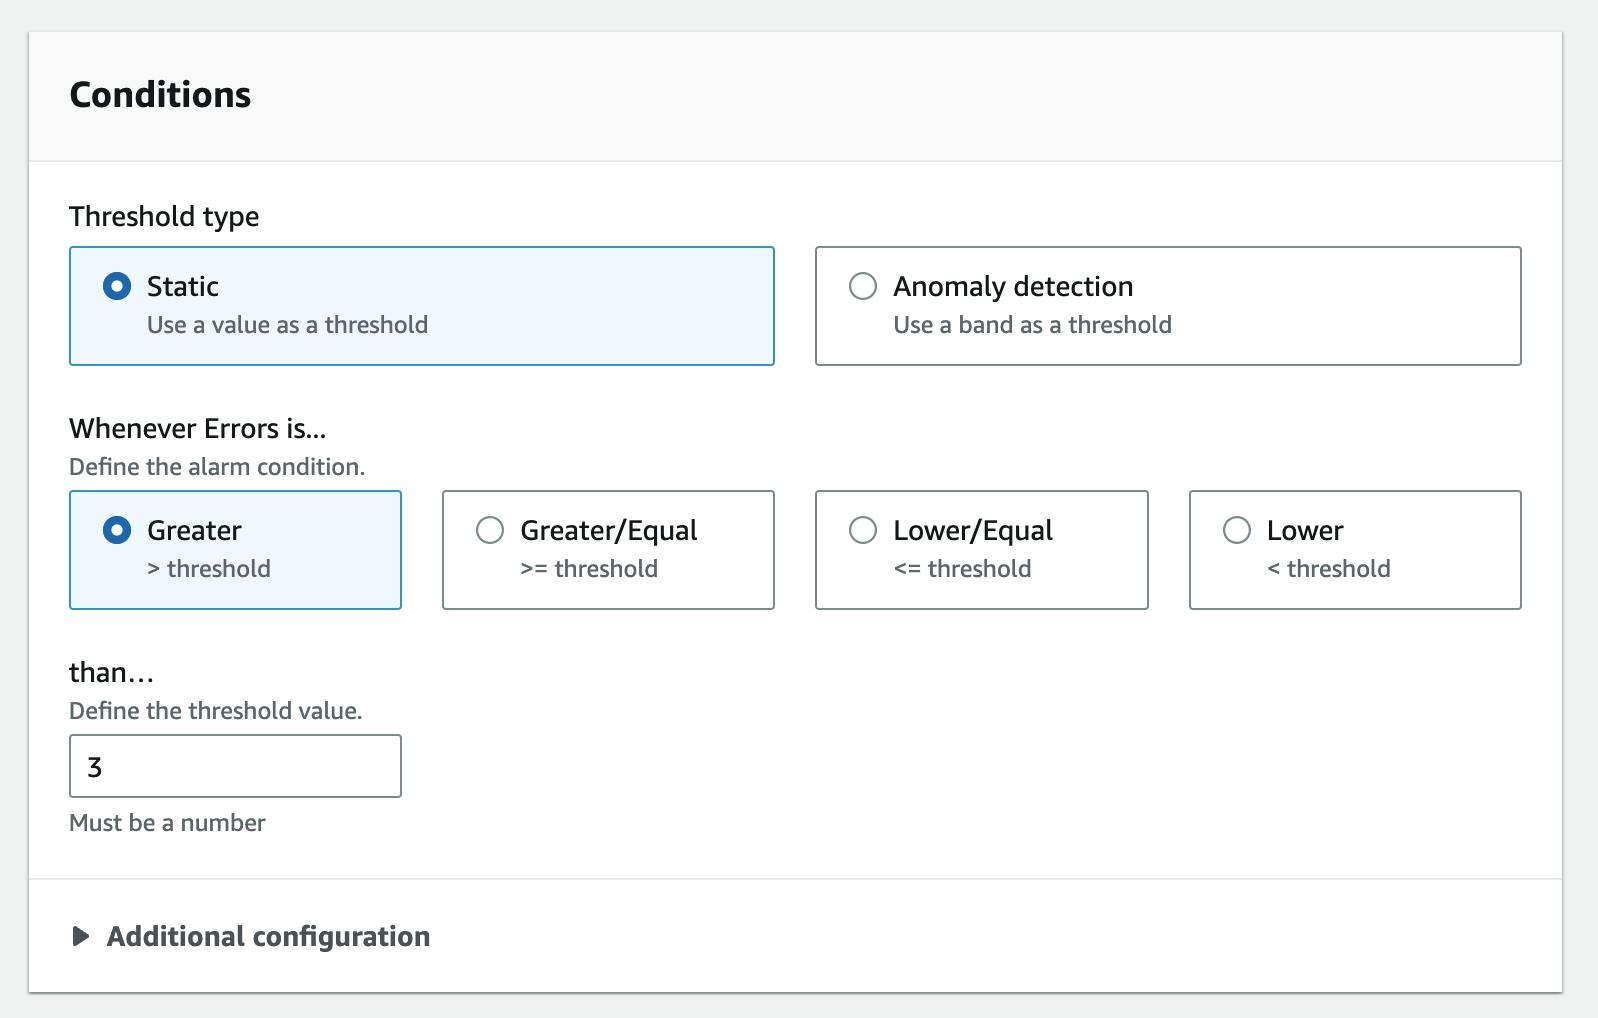
Threshold
Now we define which threshold we want to use for triggering the alarm. First of all, our metric is the number of errors over a period of 5 minutes. We use the statistics function Sample count here because we are interested in the number of errors.
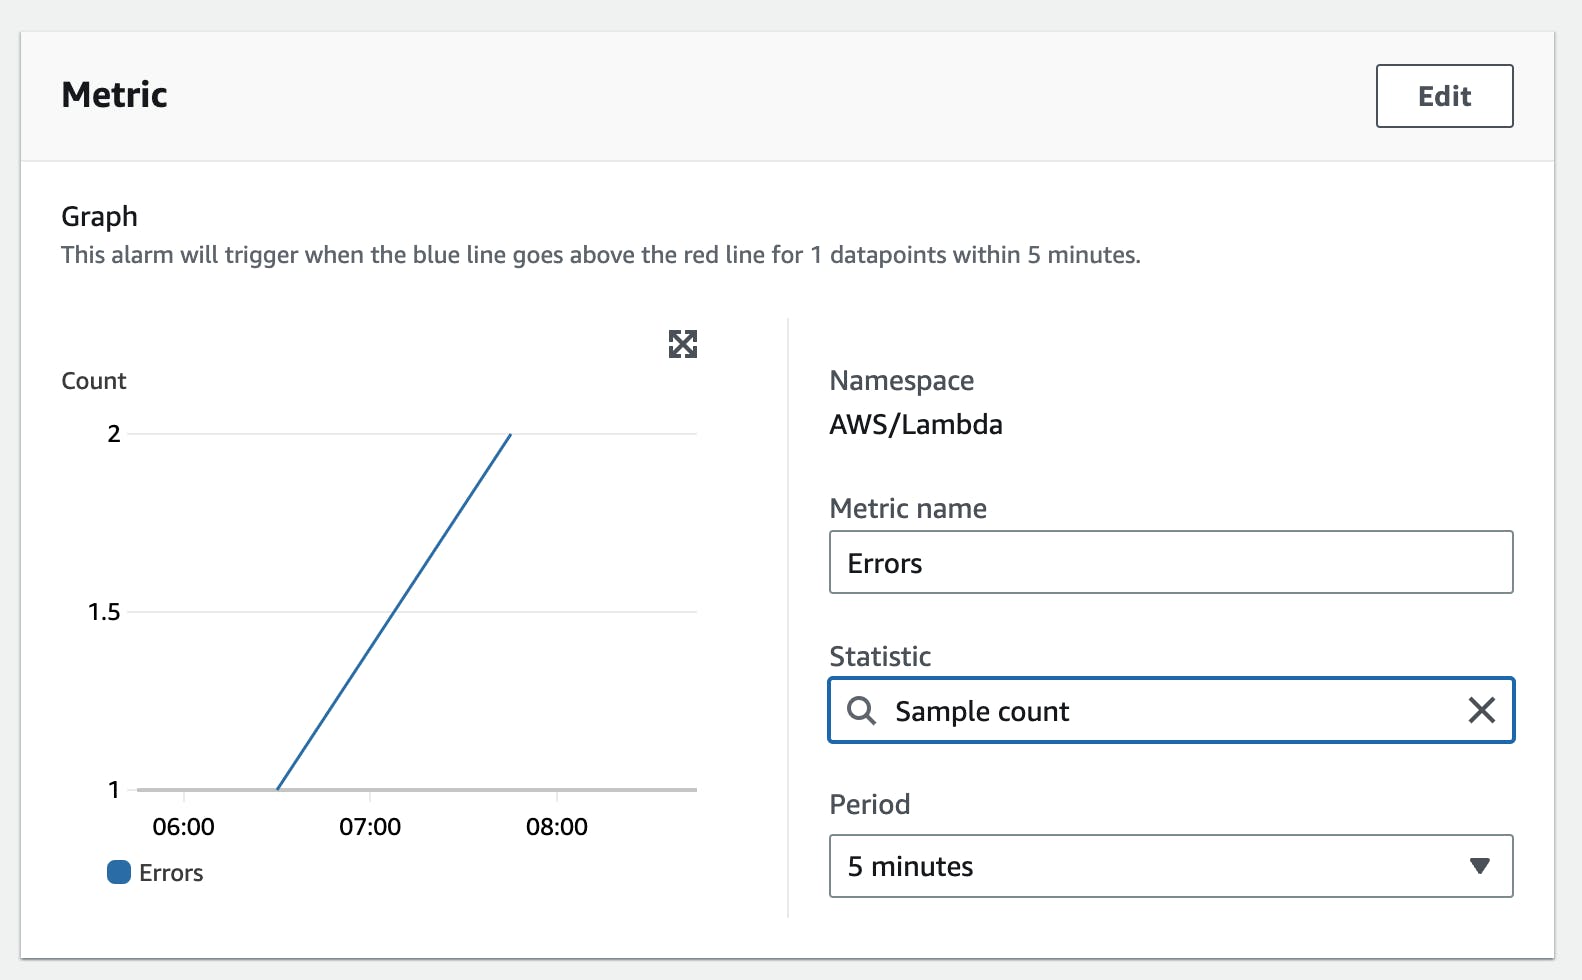
Next, we define the threshold. We want to get informed if the count of errors is greater than 3.
Create Notification
In the notification pane, we now need to select our SNS topic. We will create a new one and subscribe to my personal e-mail on that list:
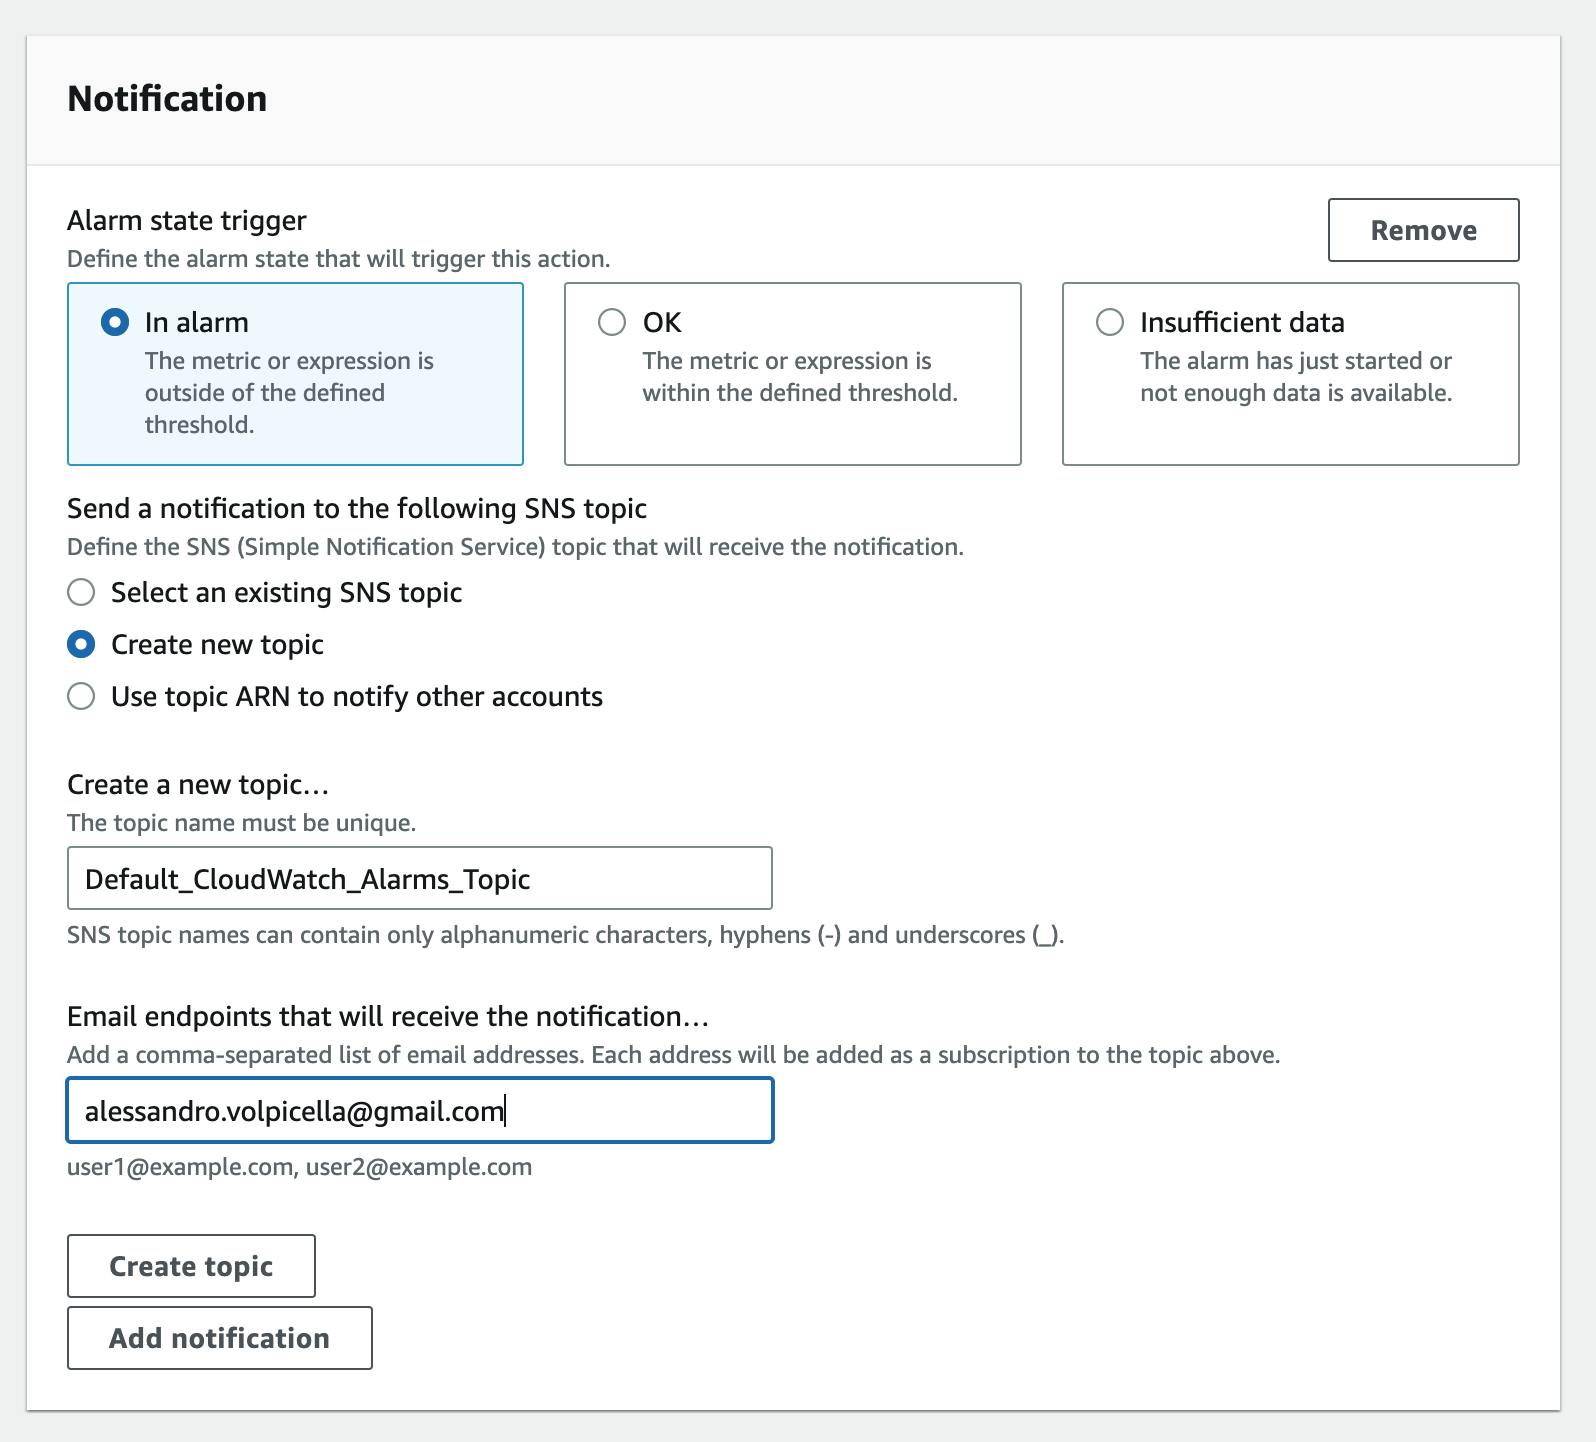
This will create an SNS topic with the name Default_CloudWatch_Alarms_Topic and my email will automatically be subscribed.
After hitting Next I can give the alarm a name. After clicking on Next I see a preview of my alarm.
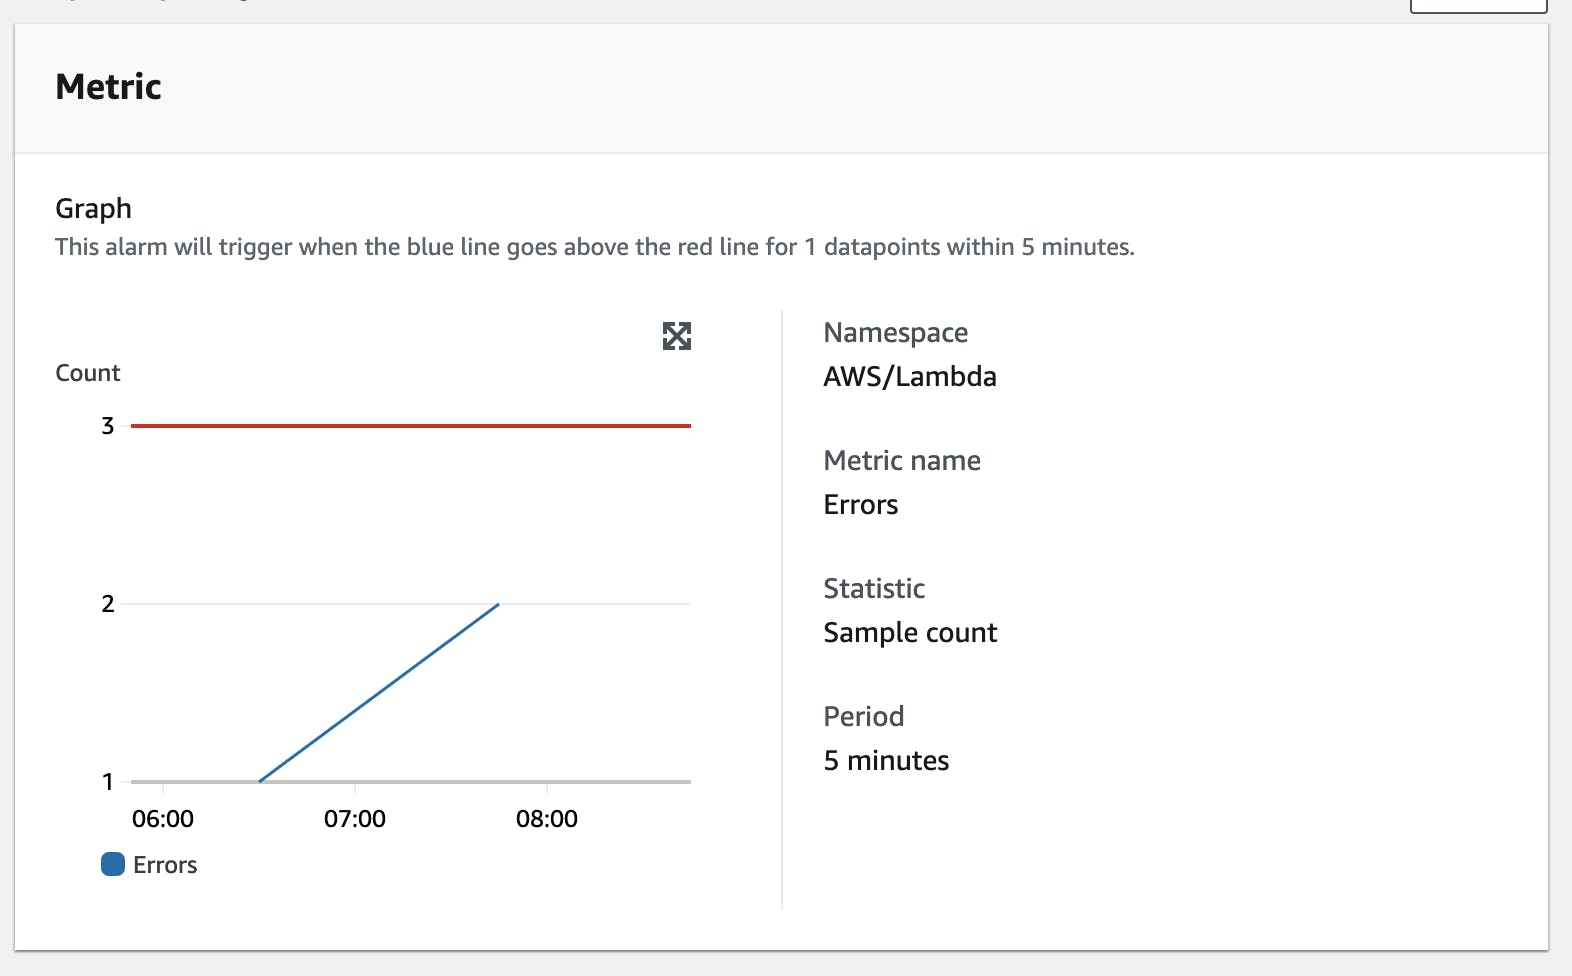
Now we create the alarm. Our E-Mail address gets an automatic subscription confirmation from AWS. That's it, your Alarm is now live!
X-Ray
Understanding user requests across your whole cloud infrastructure can be quite challenging.
For example, if a user reports an issue you need to understand the whole flow the user took. That means looking at multiple AWS Services.
X-Ray gives you the opportunity to build distributed traces for all requests. That means each user request will have an x-ray-trace-id which you can follow in the system. You then see how users interacted with your system and can also check all logs attached to this trace.
Let’s have a look at an example service map that X-Ray built for us:
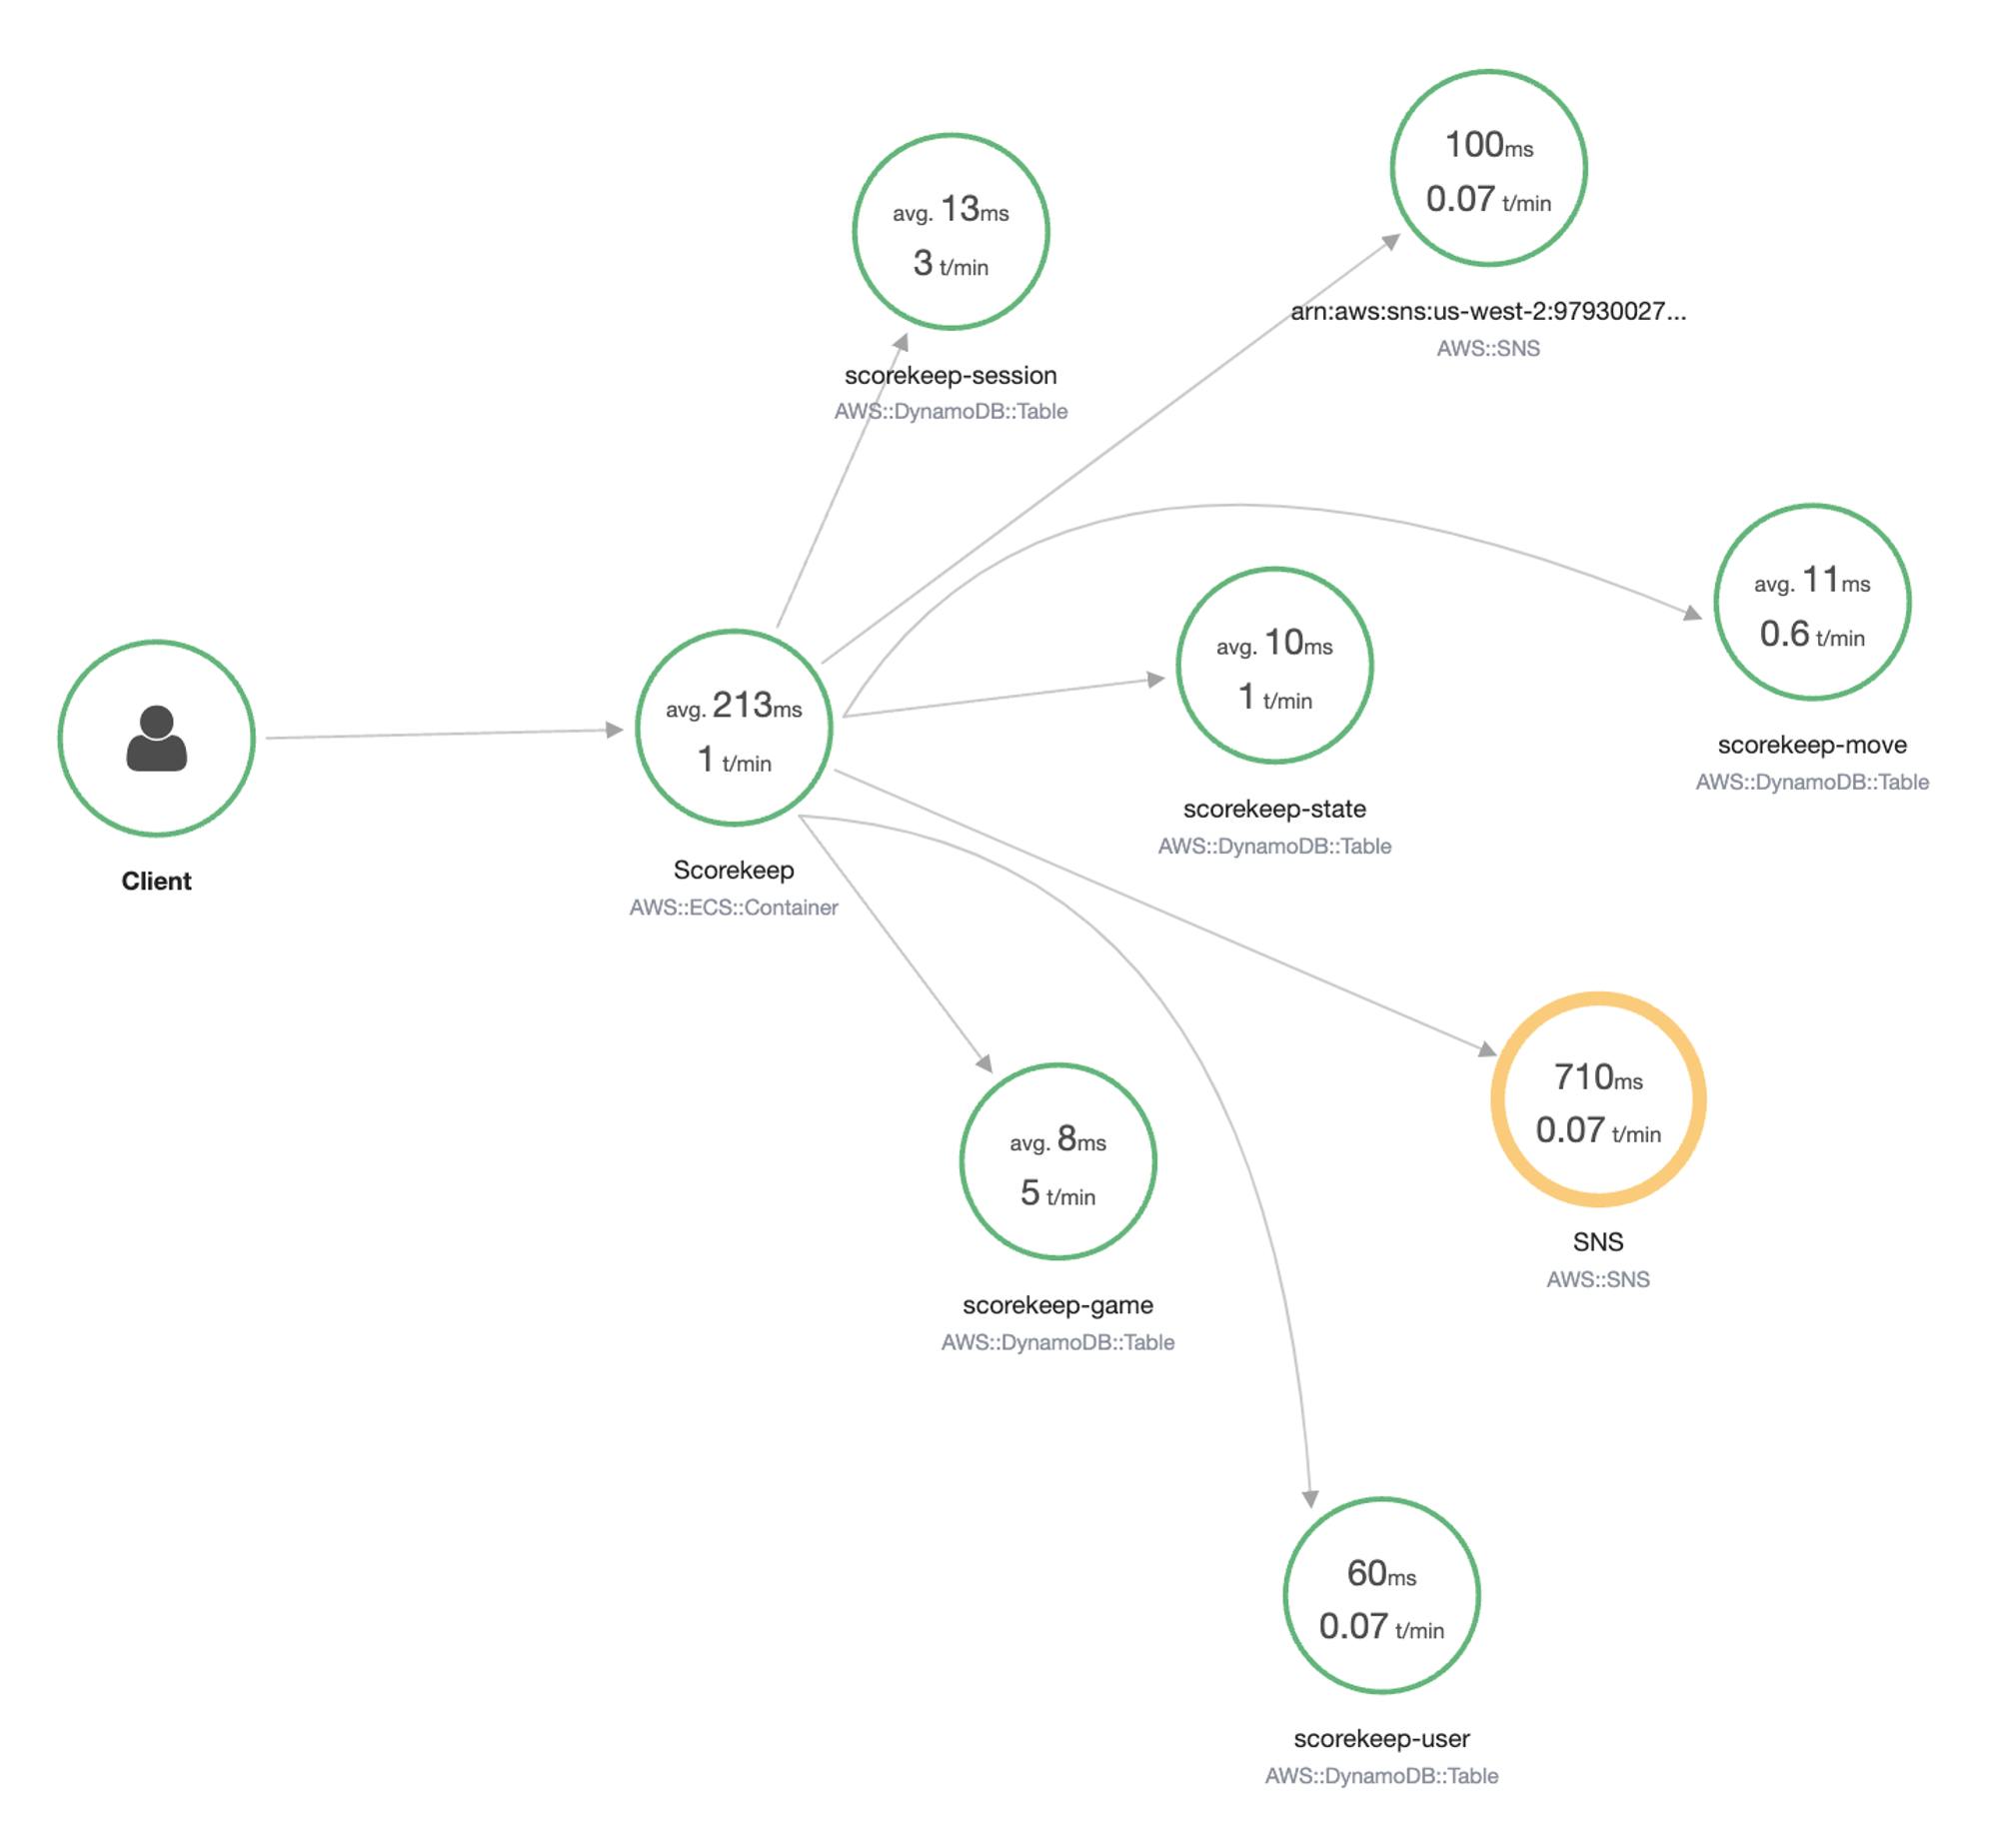
This example from the AWS Developer Documentation shows you how a client calls ECS and how ECS makes several calls to SNS & DynamoDB. You can see the latency of the requests and drill deeper into them.
X-Ray also saves all of these traces in a table. You can check them one by one to understand the requests further. This is really helpful if you have to debug user sessions. For pure serverless systems, it is quite hard to build up a complete service map. Some services are not fully supported. For example, the integration between SQS and Lambda. By that X-Ray is losing the vision of these services. It still often makes sense to activate X-Ray to understand user requests better. With the upcoming services in Open Telemetry, it can only get better.
CloudWatch Synthetics
CloudWatch Synthetics is one of the lesser-known CloudWatch services.
CloudWatch Synthetics is a service that creates so-called canaries. Canaries are scripts that run on a schedule. Their goal is to check endpoints and APIs. They are used for regular health checks of your web applications. The synthetics service falls into the category of Application Monitoring. It supports using programmatic web browsers like Puppeteer.
A canary can be of the type
Heartbeat monitor - check URLs regularly
API Canary - check API endpoints
Broken Link Checker - checks broken links
Visual Monitoring - open a webpage in the browser and check elements on that page like buttons
Canary recorder - record sessions in your browser and replace them
GUI Workflow builder - verifies that actions can be done on your web page
CloudWatch Synthetics is a great tool for integrating automated testing into your application. Selenium and Puppeteer are both browsers you can control from source code. By using them you can test your whole web application in code. With this service, you can build a fully-fleshed test suite cost-effective in AWS.
For a deeper understanding of how synthetic monitoring plays a crucial role in application monitoring and its broader context, you may want to explore this comprehensive guide on how to use synthetic monitoring. It provides valuable insights into the practice of synthetic monitoring and its importance in maintaining the health and performance of web applications.
CloudWatch Evidently
CloudWatch Evidently is the newest member of the CloudWatch family. This service allows you to create experiments and feature flagging with your users.
It majorly supports two different use cases
Dark Launches (feature flagging)
A/B Testing
Feature Flagging
Feature flags allow you to test out features with only a couple of your customers without deploying anything. This is often used in modern web applications to see how features behave and how customers react. Also, if you are unsure if your system will scale with that feature it is a good idea to ramp up the feature for a small number of your customers first.
A/B Testing
A/B Testing is all about creating experiments. For example, your landing page can have two different headlines:
Buy my book now
Learn with my book now
With A/B tests you can learn which heading performs better and use this one in the future.
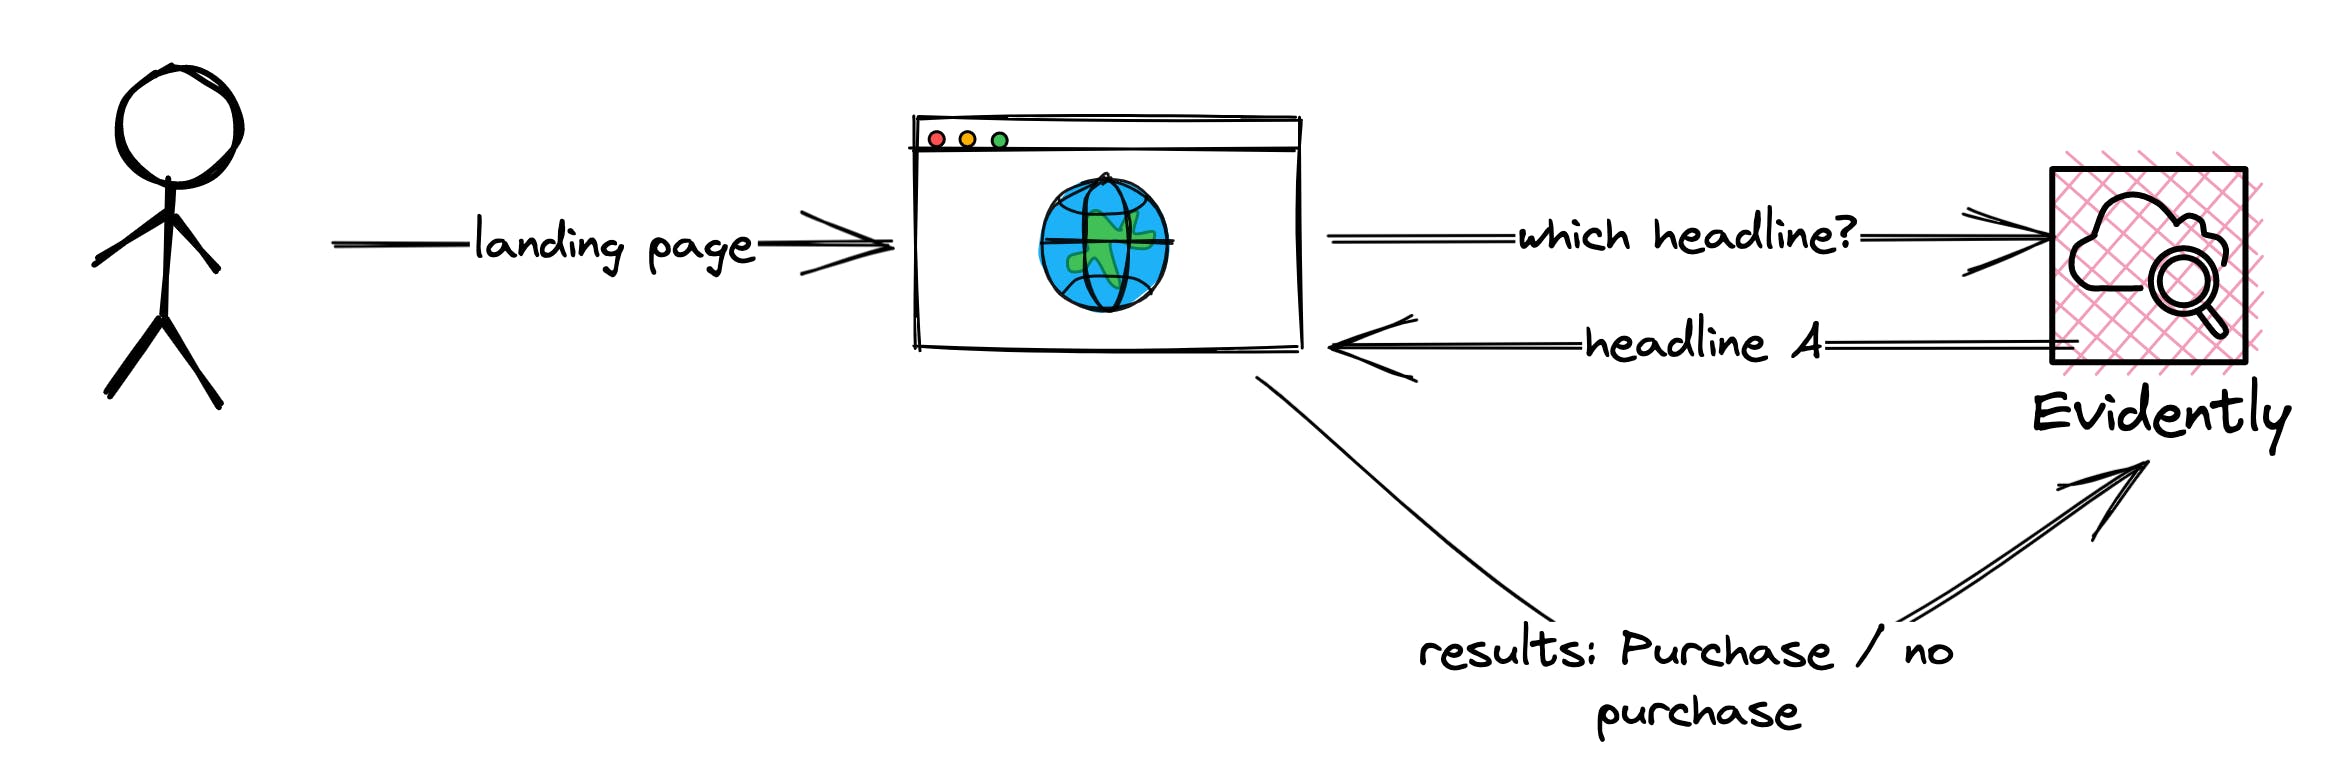
CloudWatch Evidently helps you with both of these scenarios. You can use Evidently to see statistical results that help you with your decision.
CloudWatch Pricing
CloudWatch can be quite expensive. Ingesting logs into CloudWatch can get really expensive. Let’s see how much logs are costing:
The most expensive point here is ingesting data. Storing data can be reduced by setting up a log retention policy. But ingesting logs can only be done from a business logic standpoint. Make sure you understand which data you need to log and which data you don’t need to log. Also don’t automatically activate DEBUG logs by default. Sample debug logs (like 1%) and deactivate them after.
Standard Metrics Are Free - Custom Metrics Not
Metrics are different. Default metrics of services like EC2, Lambda, etc. are stored automatically in a standard granularity (1 minute). You only pay for these metrics if you require a more granular view (1 second).
Custom metrics are really expensive.
If you have any application with a high load make sure to understand the pricing first. There are really good examples on the AWS CloudWatch Pricing page that shows you how expensive it can be to collect too many metrics.
Use the Embedded Metric Log format to get metrics much cheaper by simply logging them to CloudWatch. Check out this link for more details.
Conclusion
In conclusion, AWS CloudWatch is an essential tool for managing and monitoring resources in the AWS environment. With its central logging space, real-time data, and actionable insights, CloudWatch provides valuable information to help improve the performance and availability of your applications. The ability to set alarms based on metrics, trace requests with X-Ray, and check application health with Synthetics, make CloudWatch a complete monitoring solution.
Additionally, the native AWS tools offered by CloudWatch can help save money compared to relying on third-party tools. Whether you are a beginner or an experienced AWS user, understanding CloudWatch and its features are crucial for effectively managing and monitoring your resources in the cloud.