


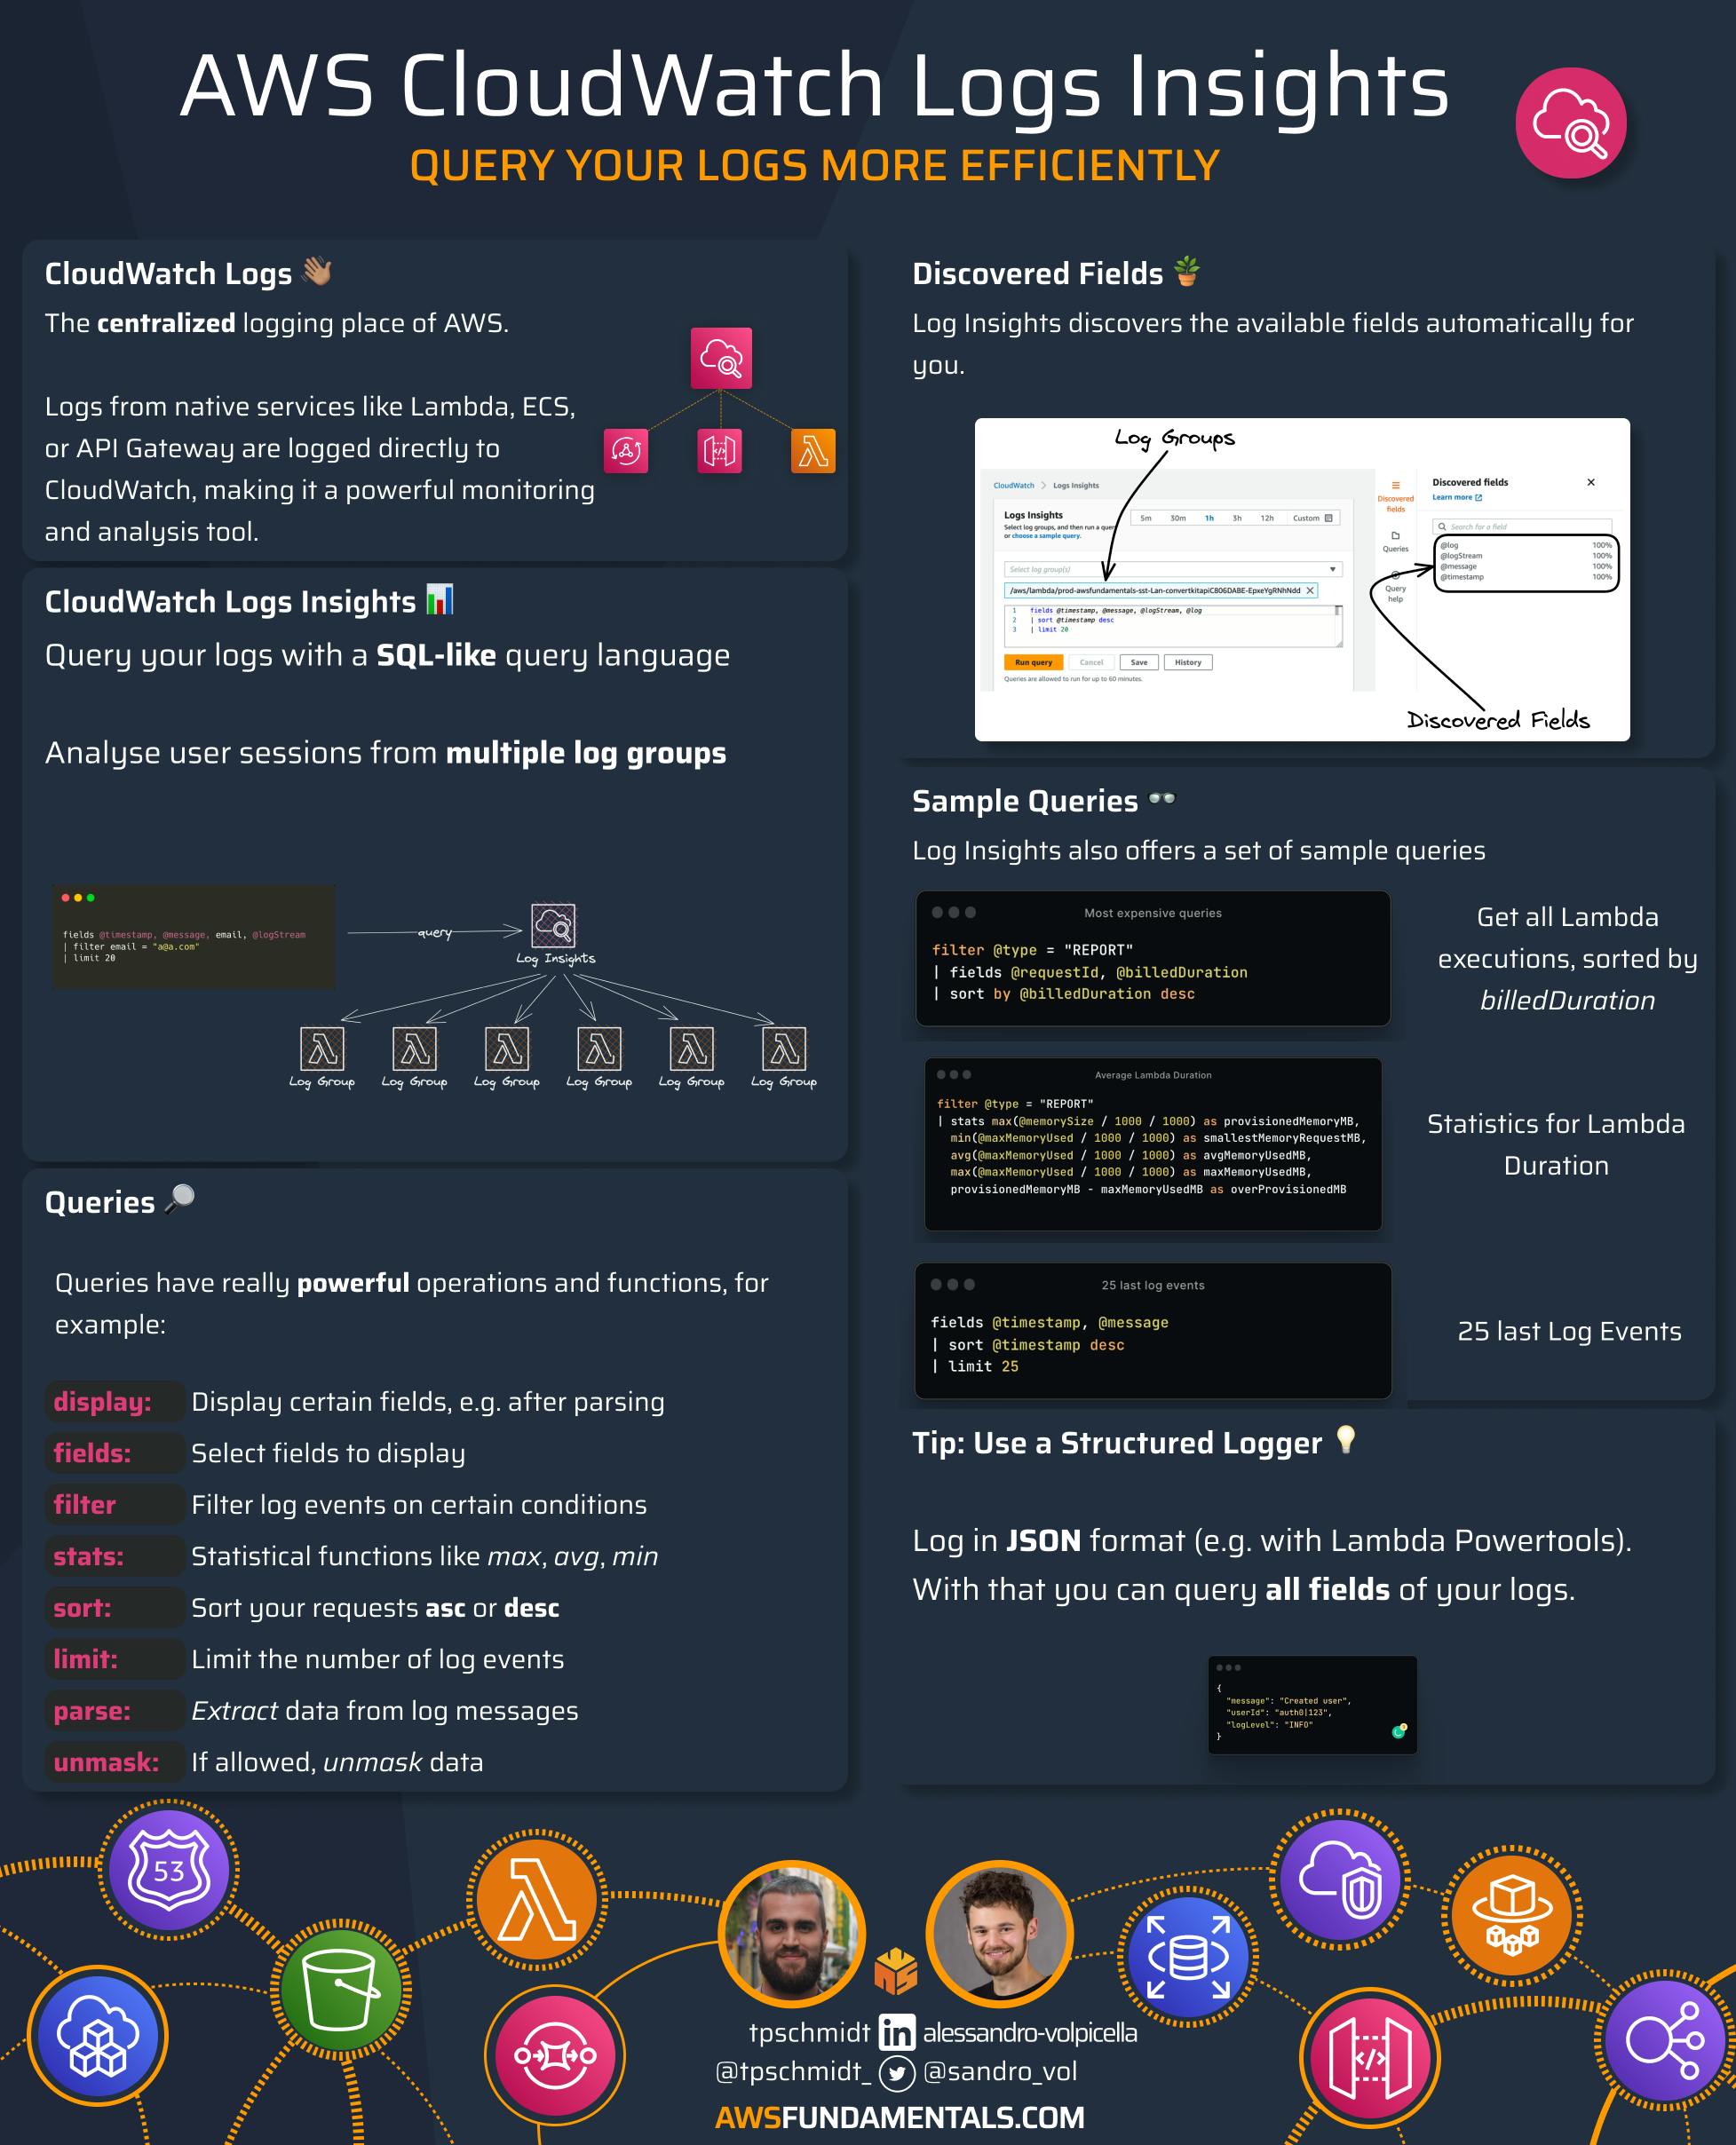
TLDR; Infographic
Introduction
Amazon CloudWatch is the service that is used in almost every AWS application. But still, many developers and administrators out there are not very familiar with how to analyze their logs more efficiently. That's why so many companies are using third-party monitoring solutions out there. While the solutions can definitely make sense, they are often really expensive.
CloudWatch Logs Insights can help you with analyzing your logs in a SQL-like query language. You will see the magic of CloudWatch Insights, especially when working in a distributed cloud architecture with several services and functions. CloudWatch Logs Insights lets you query multiple log groups at once with a powerful query language.
This post will dive deep into CloudWatch Logs Insights, shows you how to use it, and gives you several real-world examples. Let's dive straight in 🏊🏽♂️
CloudWatch Logs
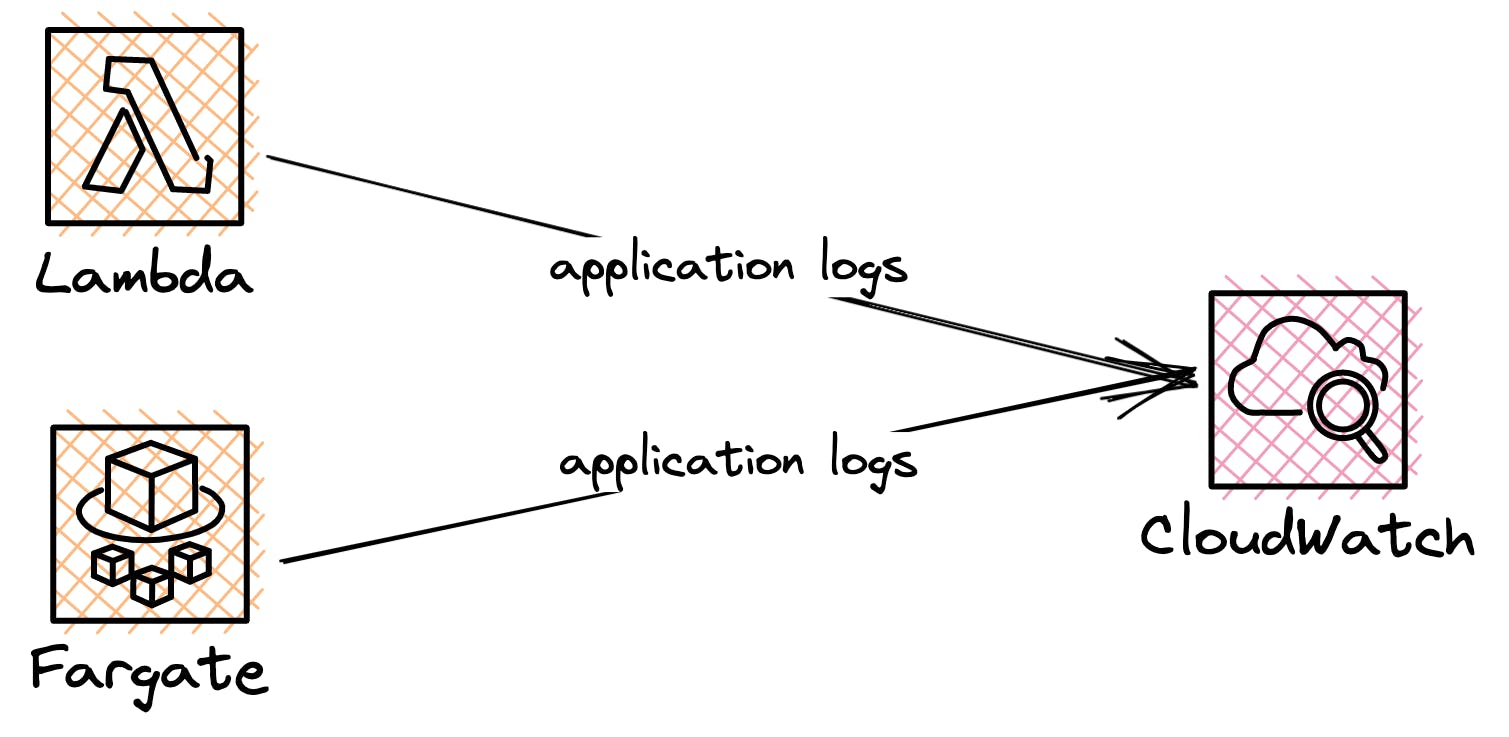
CloudWatch Logs is the main product of the whole CloudWatch suite. CloudWatch Logs is the centralized logging place of AWS. Each native service like Lambda, ECS, or API Gateway is logging directly to CloudWatch. This makes CloudWatch a really powerful monitoring and analysis tool.
To be able to analyze logs more efficiently it is needed that you have one common place where all your logs are stored. This is already a huge benefit of using CloudWatch Logs. But how can you actually analyze the logs?
CloudWatch Logs Insights
This is where Logs Insights comes into play. Logs insights let you query your logs by introducing its own query language.
The query language is somewhat similar to SQL (Structured Query Language). With SQL you can query your database in a descriptive manner. That means you only describe what you want from the database instead of telling the program how to receive it.
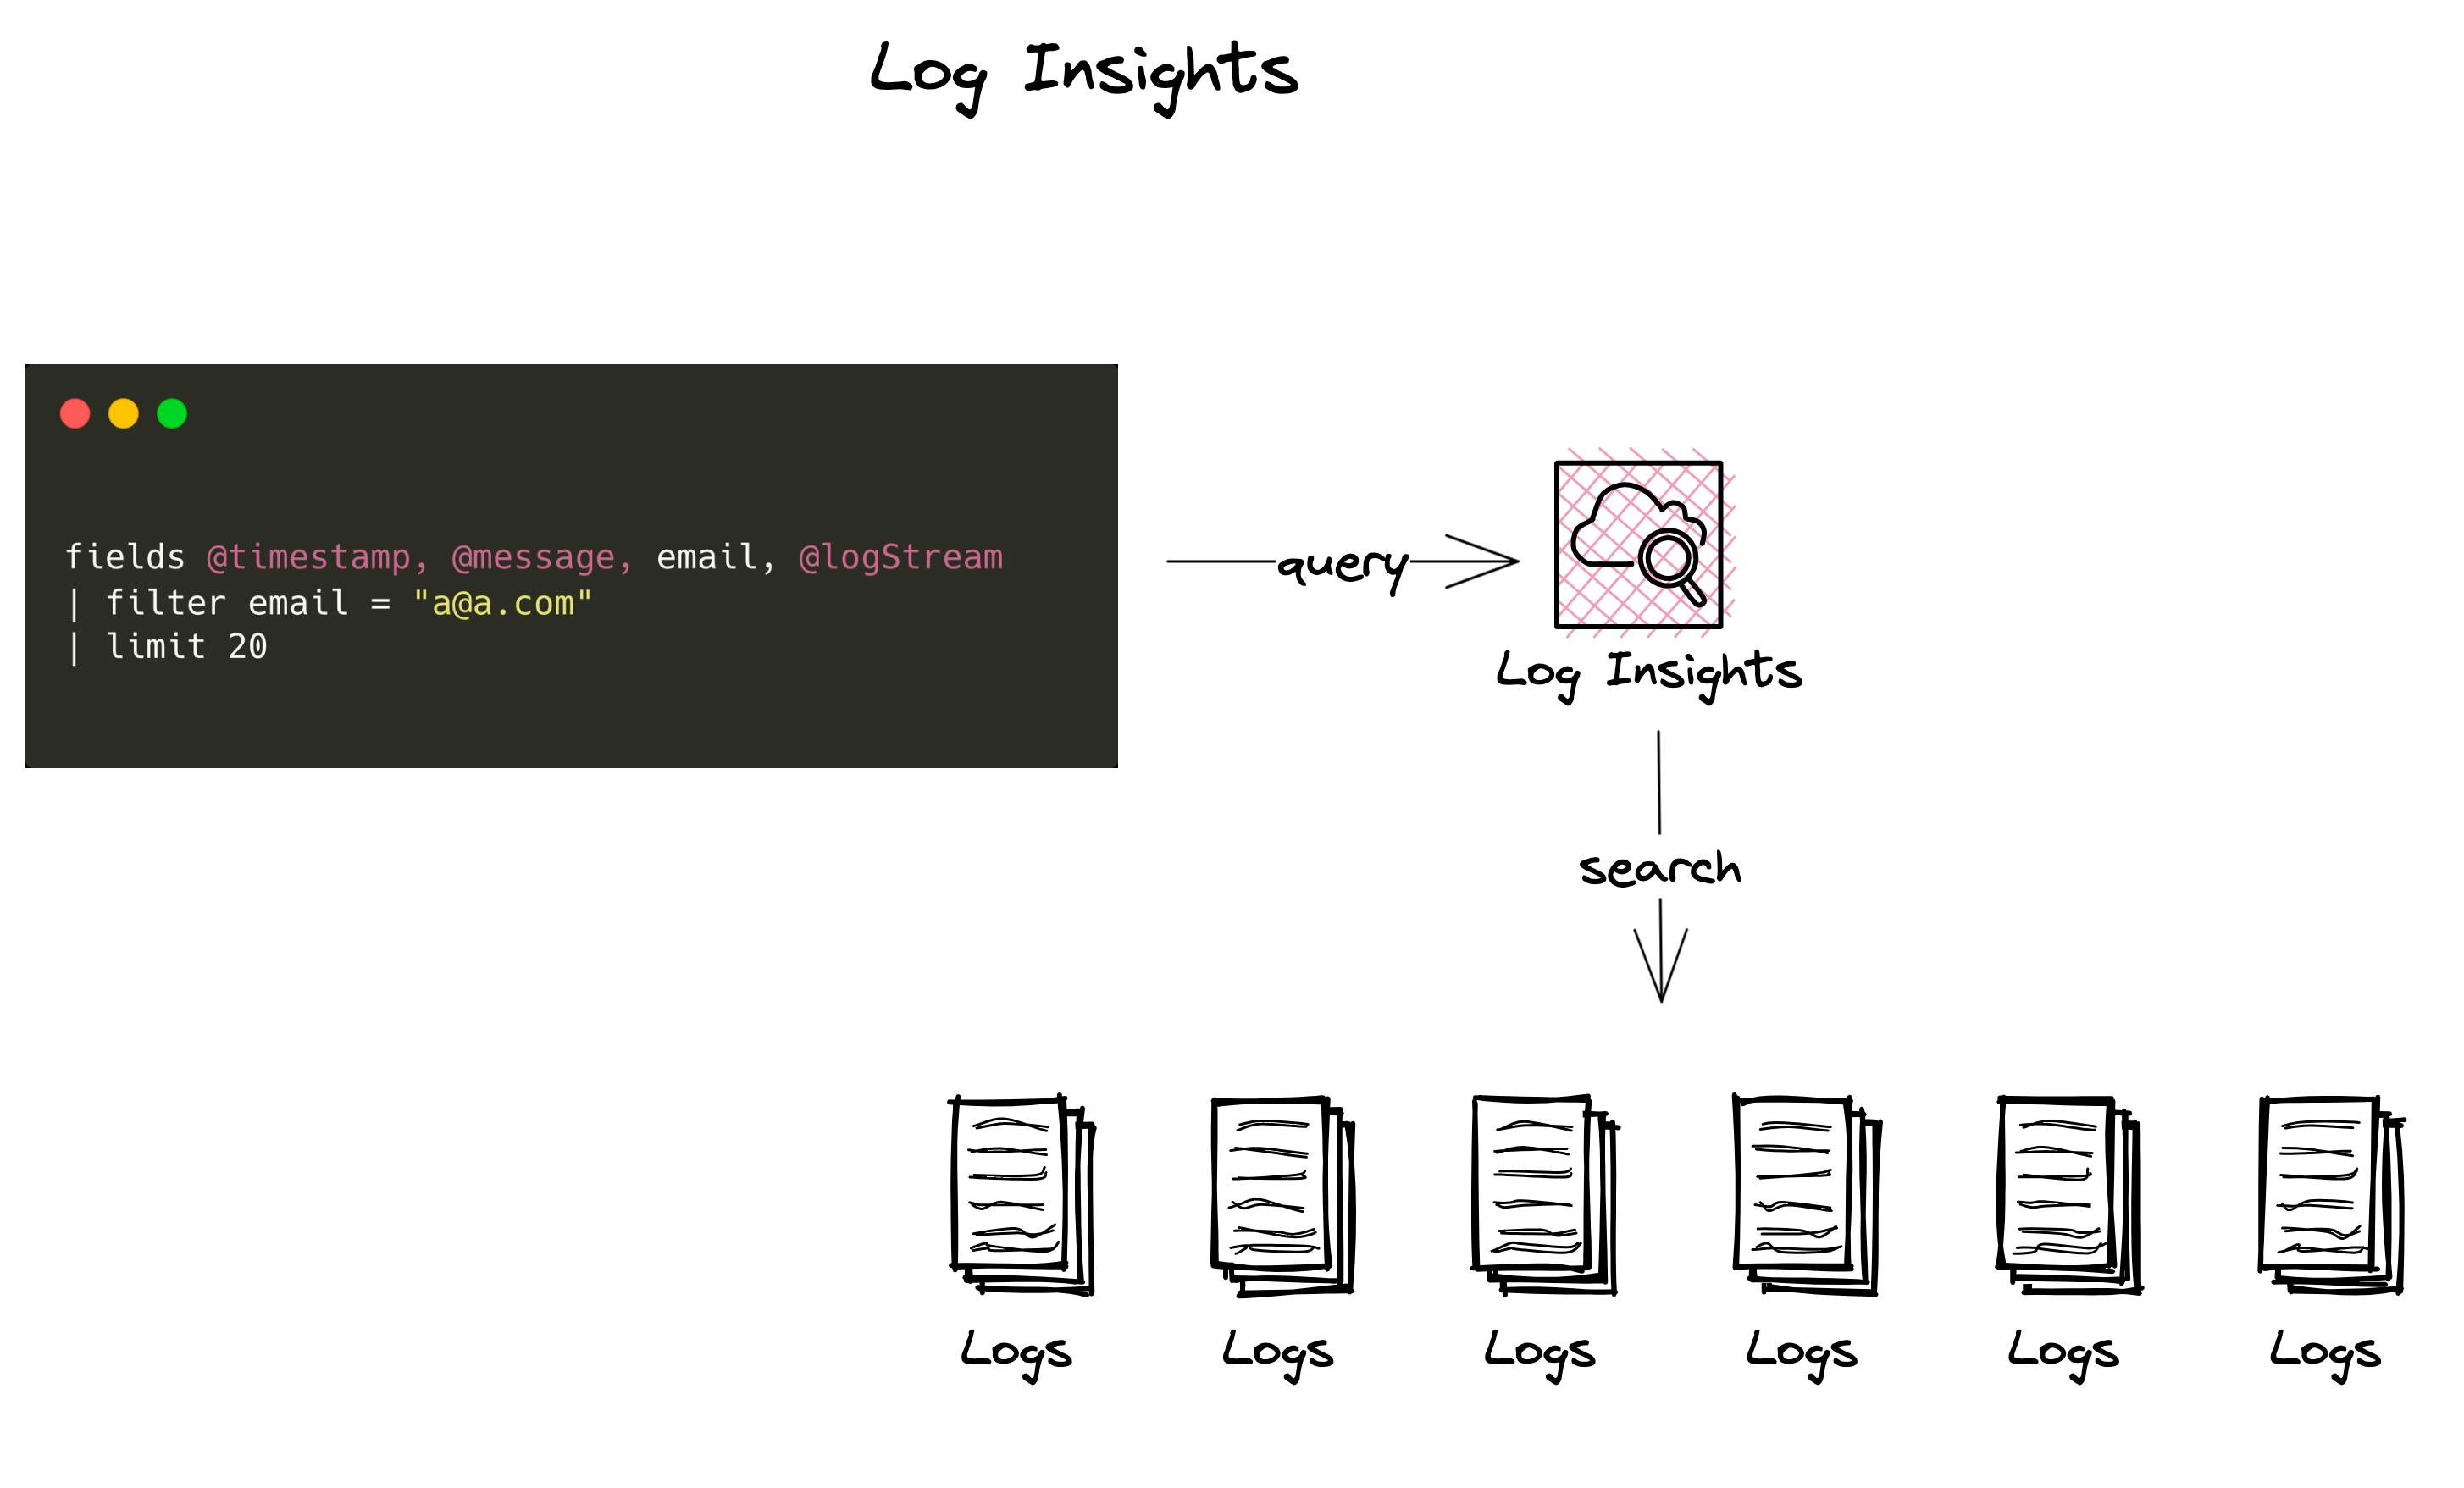
This is similar to CloudWatch Insights. If you open CloudWatch Insights for the first time you see the following query:
fields @timestamp, @message, @logStream, @log
| sort @timestamp desc
| limit 20
CloudWatch Insights Query Definition
Let's look at the query in a bit more detail. The query consists of the following fields:
fields: These are the fields you want to displaysort: This is the direction you want to sort your data. In our example, we want to sort it descending by the timestamplimit: We limit the end results to 20 to not be overwhelmed with data.
But there are many more fields to select!
stats: Calculate aggregations such as counts, averages, medians, etc.display: Show only certain fields, for example, after parsing certain data from a messageparse: Parse lets you extract data from log messagesunmask: With unmask, you can show data that was masked due to data privacy
With these 7 operations, you are able to build very powerful commands.
Discovered Fields
As mentioned above with the fields parameter you can query fields from your logs. But which fields are actually available in your logs?
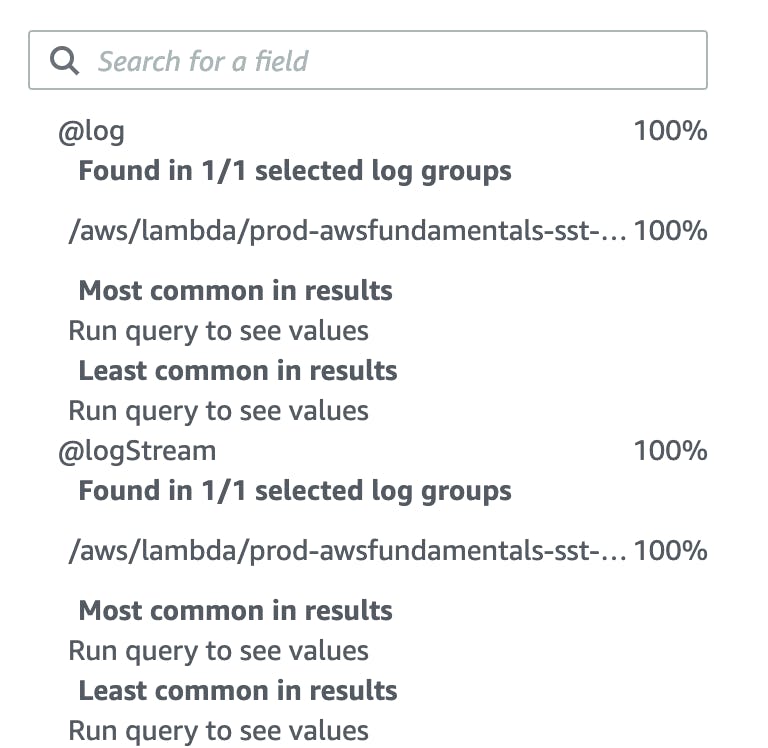
To be able to understand which ones are available Log Insights shows you the Discovered Fields tab on the right pane.
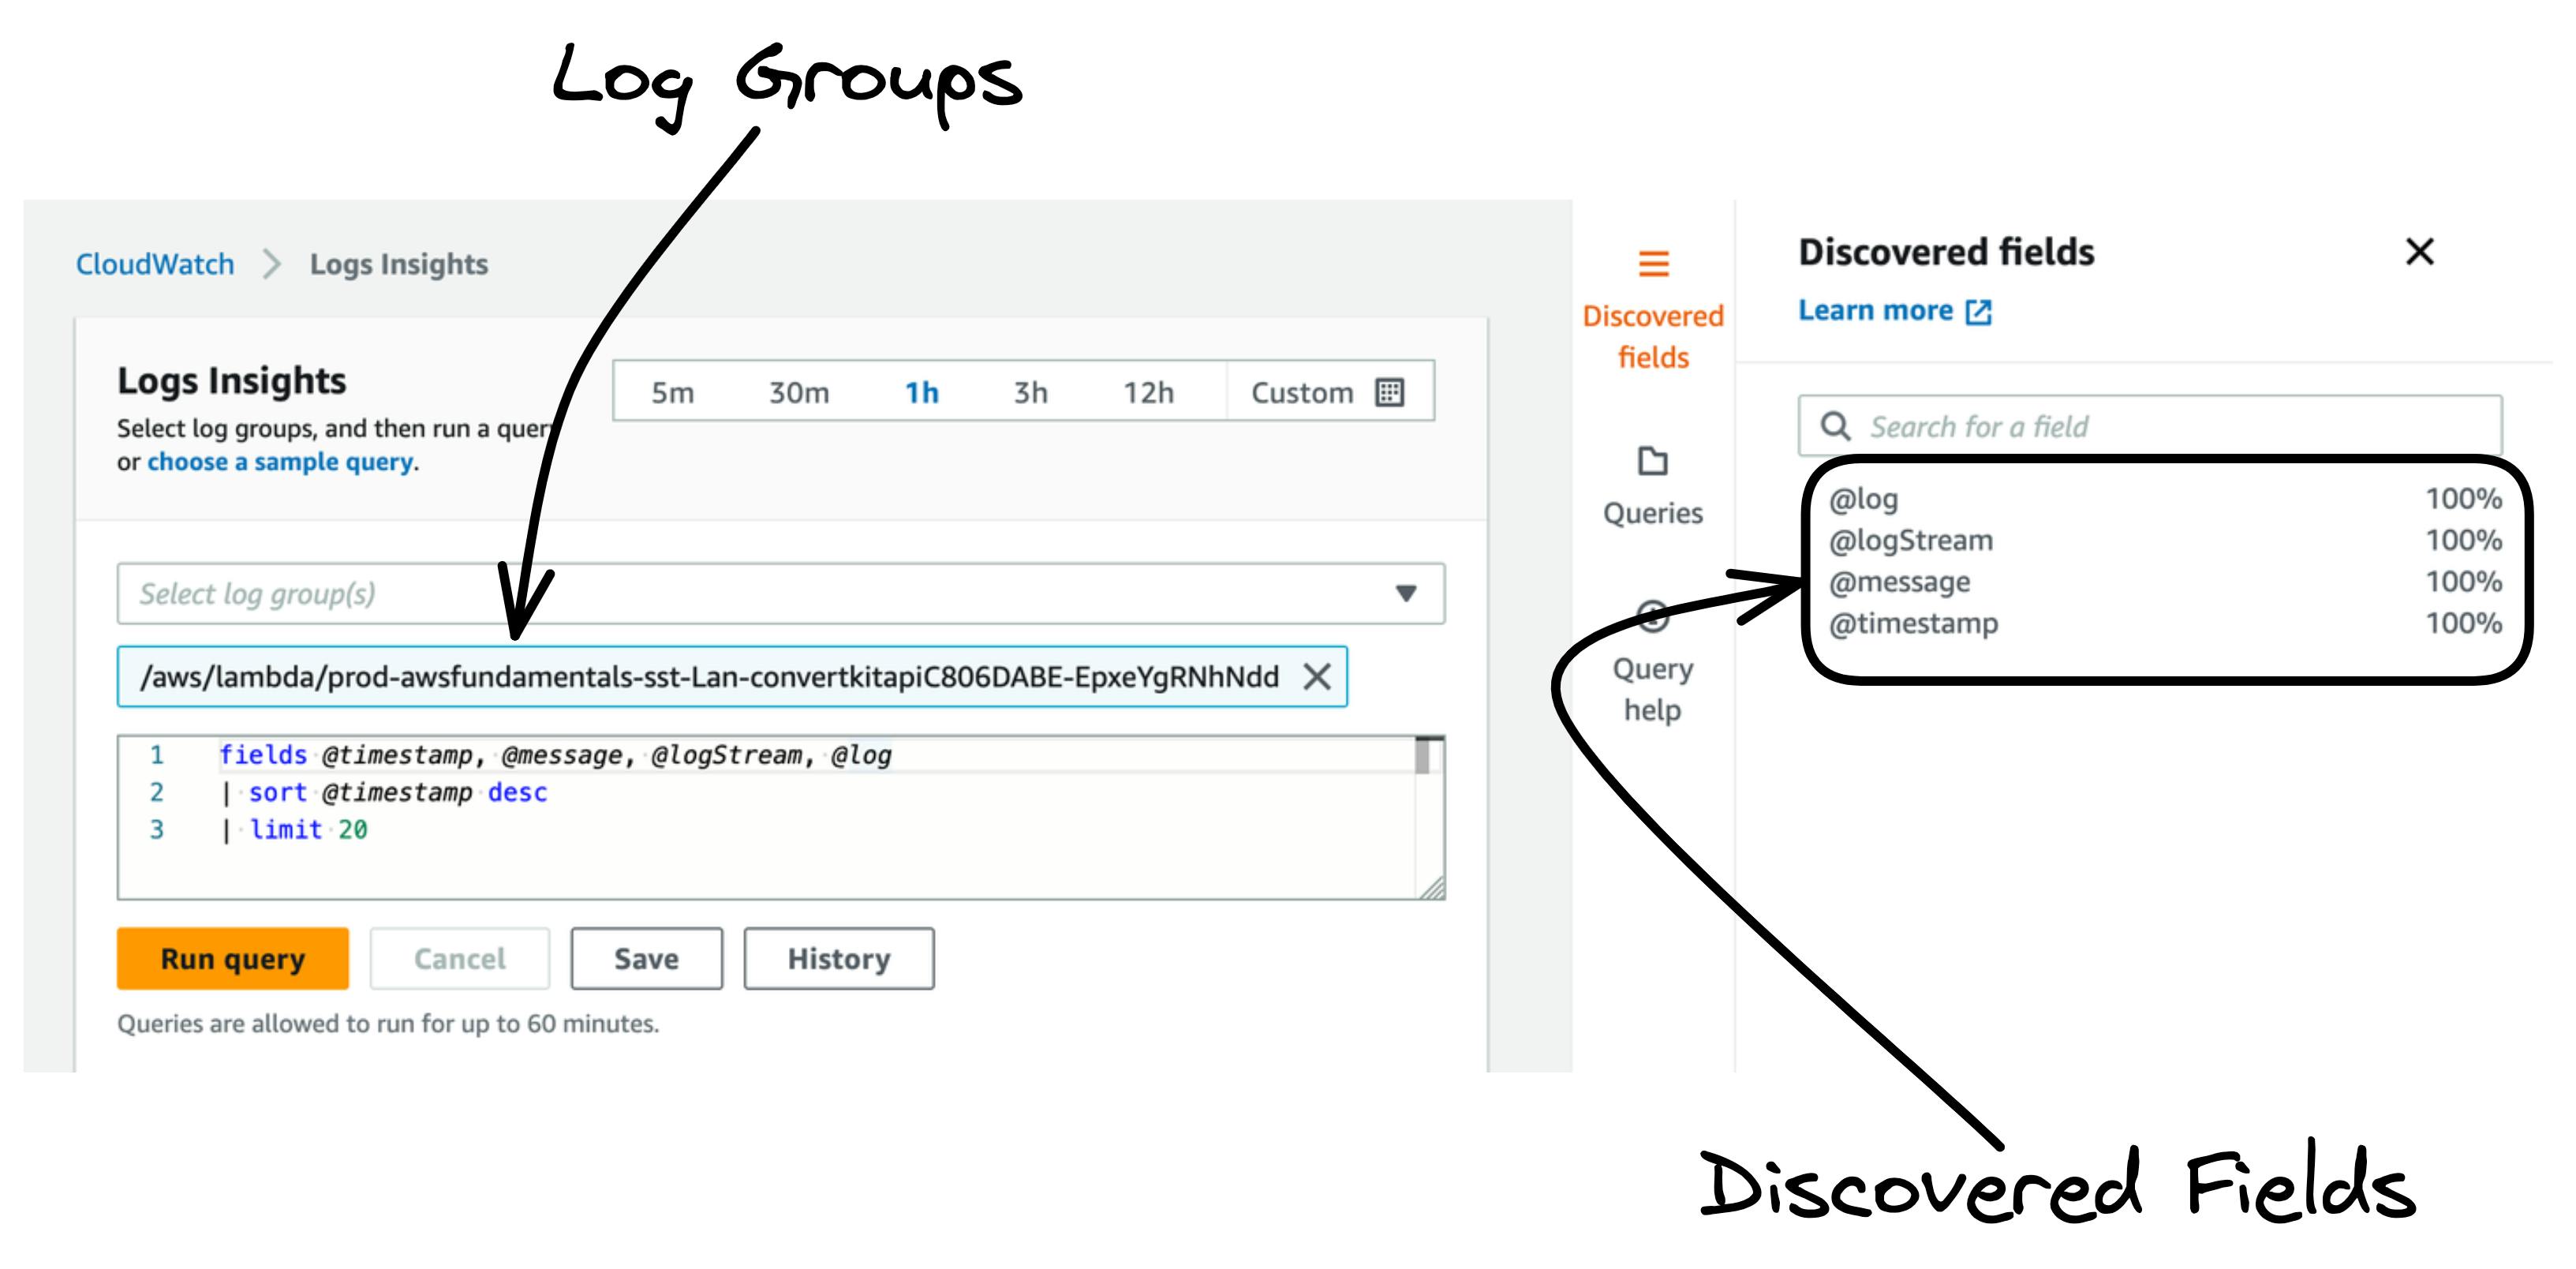
For that open CloudWatch Insights and select at least one Log Group. If you now click on Discovered Fields you will see the default fields, which are:
@log@logStream@message@timestamp
These fields are available in every log message. The percentage behind the field shows you in how many log messages this field was found. In that case, this is 100% because these fields are always available.
You can even click on the field to see in which log groups the field was found, in case you have selected more than one log group.
Find more fields
If you have more fields available run a sample query once. CloudWatch Insights will then scan all the fields it can find and adds them on the right pane.
In the quick video, you can see how much more fields could be found after scanning the logs. Make sure to scan a longer range of your logs to find enough logs.
Sample Queries from AWS
Creating queries can be quite difficult at the beginning. This is why AWS provides you with a set of sample queries. If you head to the right side you see the tab Sample Queries:
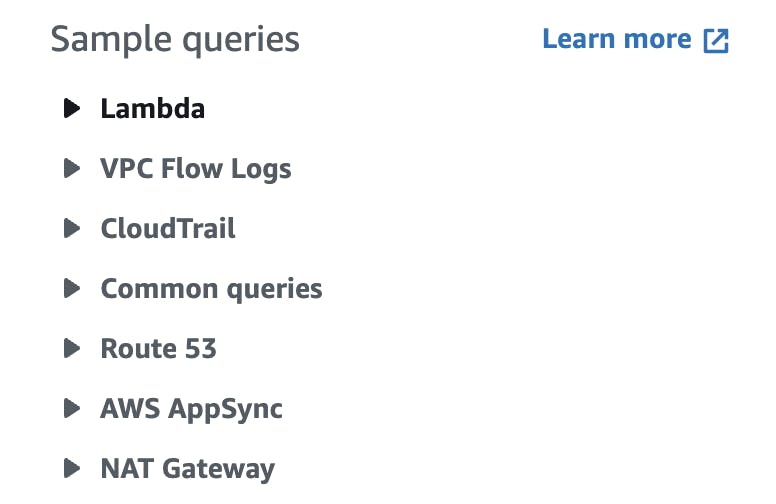
These sample queries can help you a lot to get started. Let's look at a few of them in more detail:
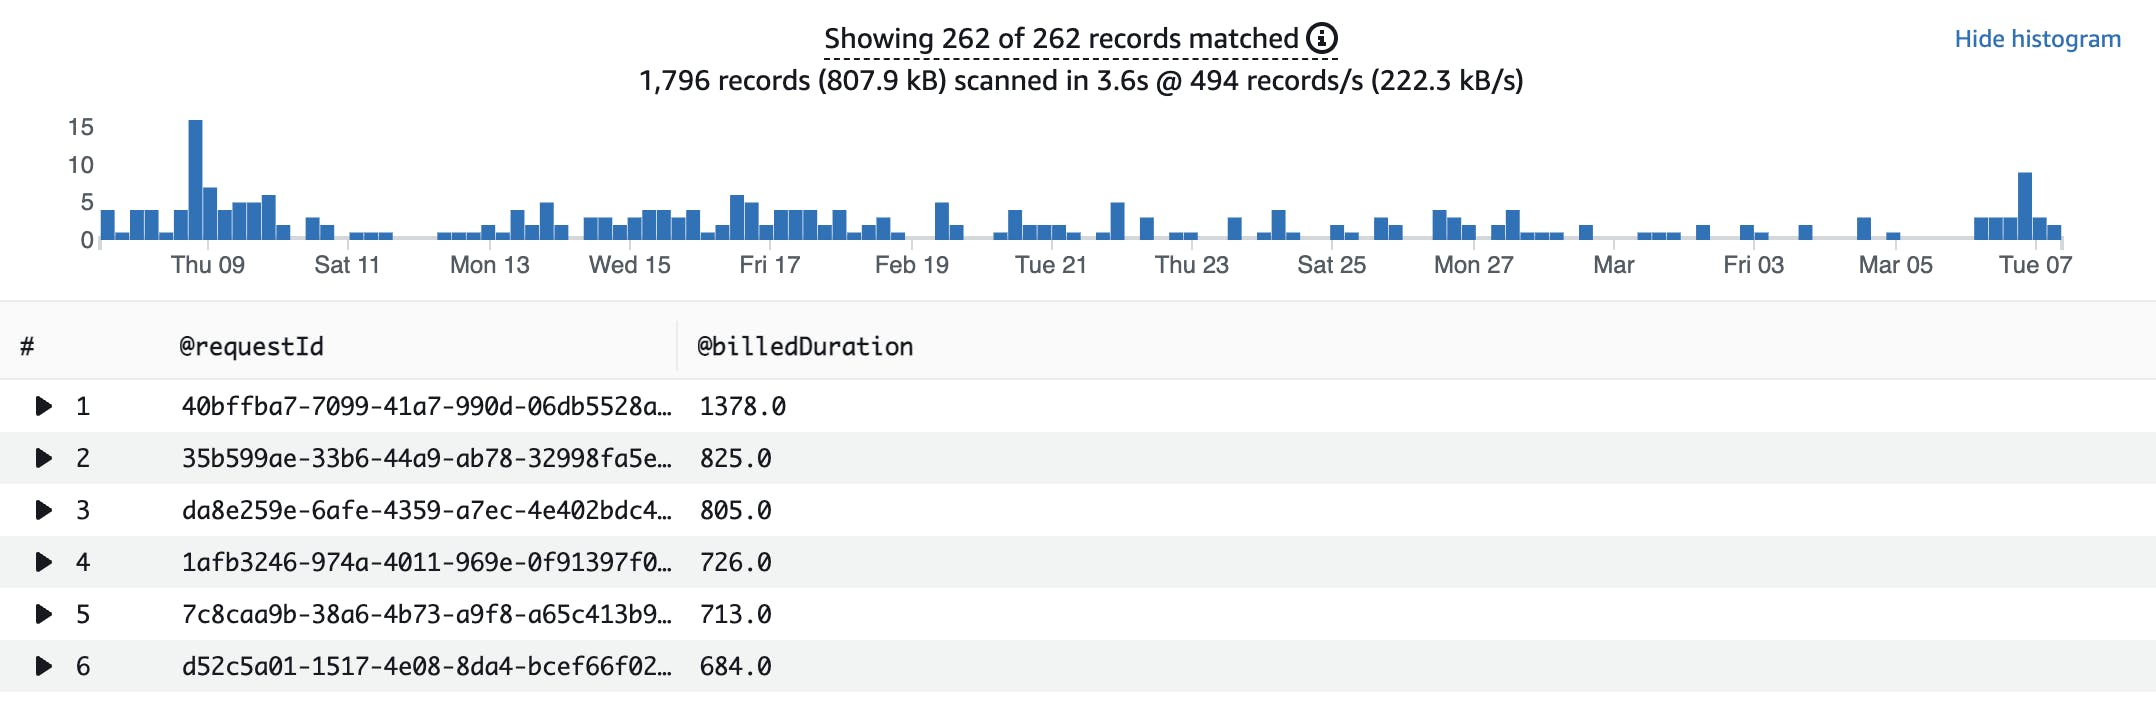
Lambda - Find the most expensive requests
filter @type = "REPORT"
| fields @requestId, @billedDuration
| sort by @billedDuration desc
This query shows you the most expensive requests in Lambda. Lambda has its own field @billedDuration. The query selects the fields @requestId, @billedDuration and sorts them by @billedDuration descending.
The output looks like that:
Lambda - Determine the amount of overprovisioned memory
A second interesting query is to find overprovisioned memory in Lambda.
filter @type = "REPORT"
| stats max(@memorySize / 1000 / 1000) as provisionedMemoryMB,
  min(@maxMemoryUsed / 1000 / 1000) as smallestMemoryRequestMB,
  avg(@maxMemoryUsed / 1000 / 1000) as avgMemoryUsedMB,
  max(@maxMemoryUsed / 1000 / 1000) as maxMemoryUsedMB,
  provisionedMemoryMB - maxMemoryUsedMB as overProvisionedMB
This query uses the statistical functions max, min, and avg. It calculates how much memory was used and how much was actually needed. This is the recommendation to set as a new memory setting.
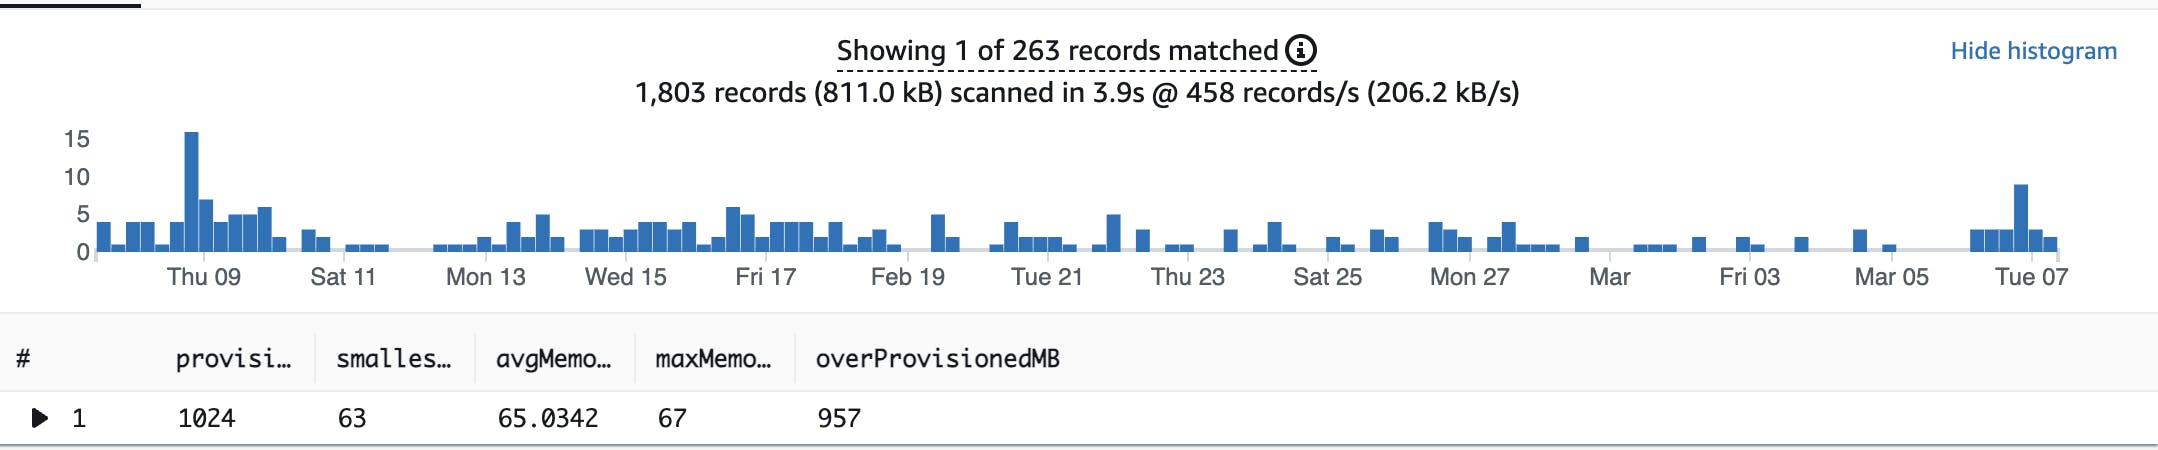
This Lambda for example has 957 MB too much memory.
Lambda - View Duration Statistics
The last Lambda sample query is to display latencies in your Lambda function:
filter @type = "REPORT"
| stats avg(@duration), max(@duration), min(@duration) by bin(5m)
The output looks like that:
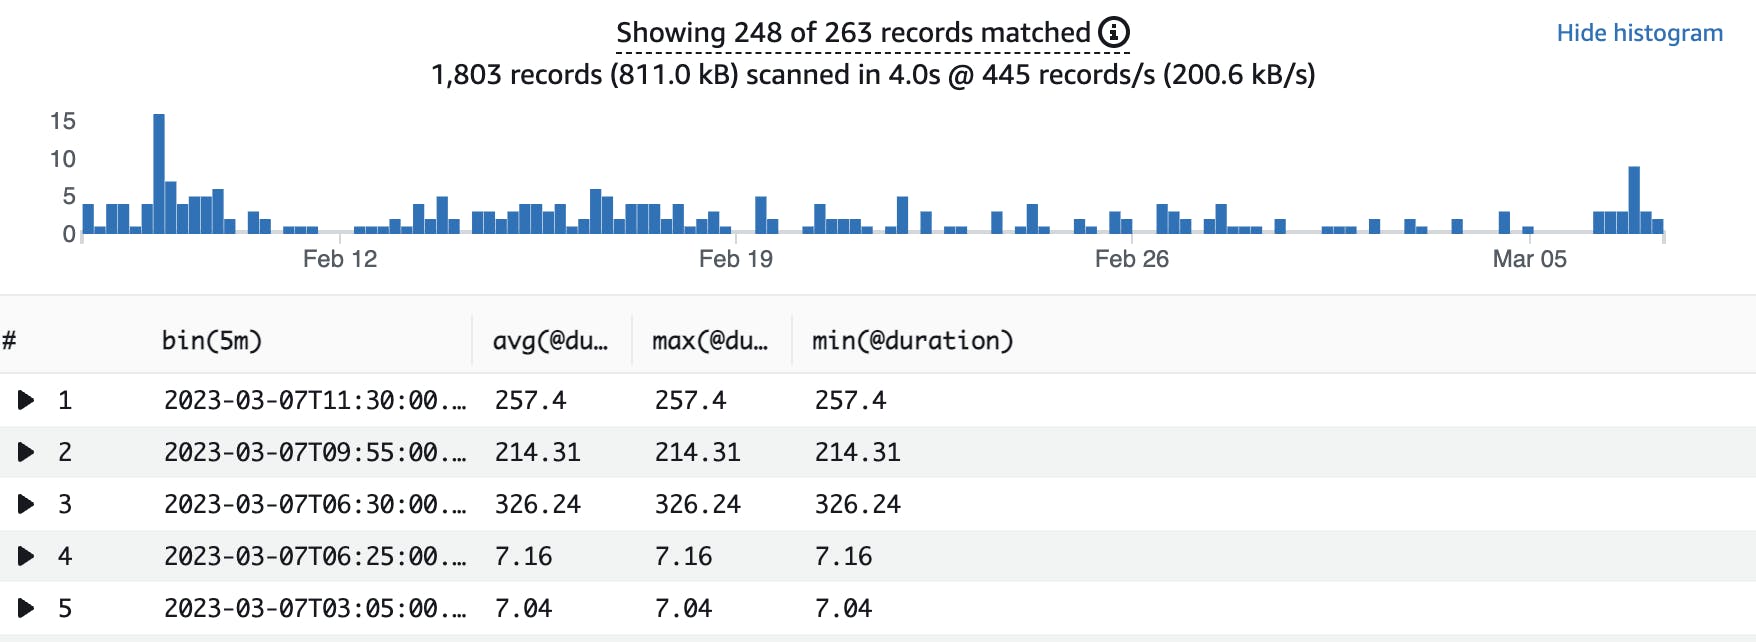
This shows you how long your Lambda functions run in average, max, and min in 5 minutes bins.
More Queries
There are many more sample queries out there, for example:
Find errors in your functions
25 recent log events
Trim whitespaces
AppSync - Requests by status code
You can find even more query ideas on serverlessland.
Multiple Log Groups
CloudWatch Insights is especially useful if you have multiple log groups. User sessions normally log to several log groups at once. For example, a user journey could look like that:
User signs up -> API Gateway, Cognito, Lambda
User creates a first item in your application: Lambda, DynamoDB
User receives welcome mail: SES, Lambda, DynamoDB
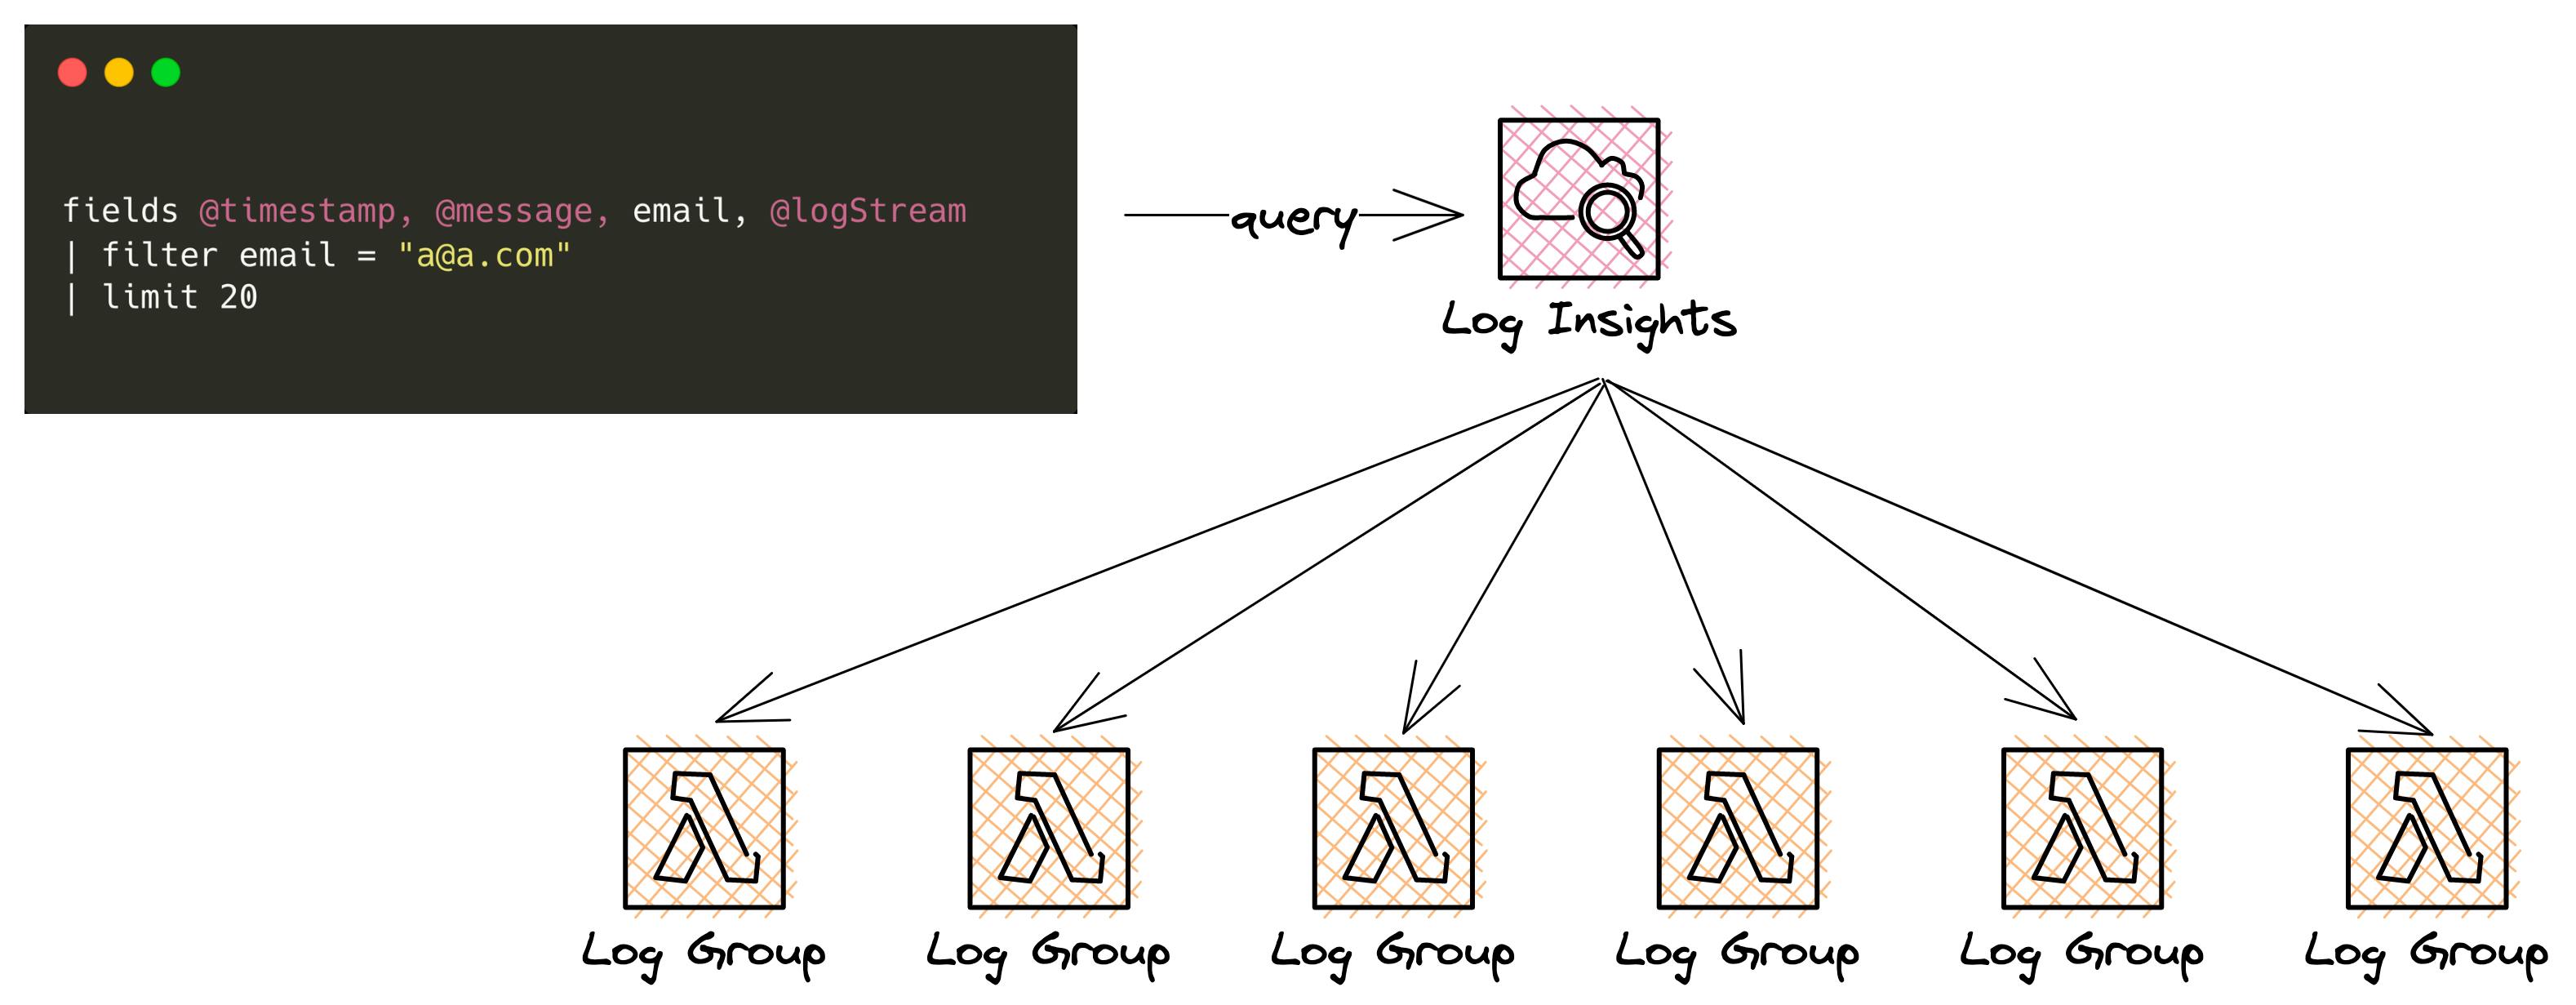
Only to understand this whole flow it is needed to query at least 3-5 log groups. With Log Insights this is possible.
Excourse: Structured Logs
One important thing to mention is how you actually log in to your applications. CloudWatch Log Insights is only able to query your logs if you use some sort of structured logging approach. Structured logging means that you need to log in a structured way with JSON logs.
CloudWatch Logs Insights can automatically parse this JSON and discovers the fields.
Here is an example of logging in a non-structured way in Node.JS:
console.log(`UserID ${userId} has faced error ${error}`)
Here is an example of a structured log:
logger.info("User faced error", {userId, error})
We highly recommend using some sort of structured logger (e.g. Lambda Powertools) that takes care of that automatically.
Thanks!
That's it. Thank you so much for reading the article.
Do you have any queries you always use and would like to add here? Add them to the comments 👇🏽